In the previous post we looked at how to visualize our data using Superset. In this post we’ll look at embedding our dashboards. Embedding allows us to display a dashboard outside of Superset and within a webpage. This lets us blend analytics seamlessly into the user’s workflow. We’ll tweak a few Superset settings to allow us to embed a dashboard, and then build a Flask application which will render it in a webpage. We’ll also look at row-level security which lets us limit a user’s access to only those rows that they are allowed access to.
Getting started
Let’s say we’d like to create a dashboard that consists of a line chart and a table. The line chart plots the number of orders the user has placed daily. The table shows the cafes where the user frequently orders from. We’ll start by writing a query which will enable us to create the line chart. This will be stored as a view so that rendering the data produces realtime results. The query is as follows.
1 | CREATE VIEW hive.views.daily_orders_by_users AS |
Next, we’ll create the view which will tell us the cafes the user orders from. It is as follows.
1 | CREATE VIEW hive.views.frequent_cafes AS |
Once the views have been constructed, we can use them in Superset to build our dashboard. To enable dashboard embedding, we must first update some Superset settings. If you have any Superset containers running from the last post, start by shutting them down. Then, run the following command to remove any Docker images linked to Superset; we’ll rebuild it with the new settings.
1 | docker images | grep superset | awk '{print $3}' | xargs docker rmi |
Let’s begin editing the settings. Navigate to the superset directory within the superset repository and open the config.py file. This contains the configuration that will be used by the Superset application when it runs. We’ll edit this line-by-line and see why these changes are required. First, we’ll disable the Talisman library used by Superset. Find the variable TALISMAN_ENABLED and update it to the following.
1 | TALISMAN_ENABLED = False |
Talisman is a Python library that protects Flask against some of the common web application security issues. Since we’ll be running this locally over HTTP, we can disable this to allow the embedded dashboard to render within the webpage. Next, we’ll disable CSRF protection. Again, all of these settings are to make things run locally over an HTTP connection. You should let these be for production deployment. Find the variable WTF_CSRF_ENABLED and set it to False.
1 | WTF_CSRF_ENABLED = False |
Next, enable dashboard embedding. This is disabled by default. Find the EMBEDDED_SUPERSET variable and set it to True.
1 | "EMBEDDED_SUPERSET": True |
Finally, we’ll elevate the permissions of the Guest user to enable us to render dashboards in an iframe. Set GUEST_ROLE_NAME to Gamma.
1 | GUEST_ROLE_NAME = "Gamma" |
Superset has some predefined roles with permissions attached to them. The Gamma role is the one for data consumers and has limited access. Assigning the Gamma role to the guest user lets us embed the dashboard within a web application. As we’ll see shortly, we’ll generate a guest token which we’ll use when embeding a dashboard.
With these changes made, we can rebuild the Superset images. Run the following command to build them.
1 | TAG=4.1.1 docker compose -f docker-compose-non-dev.yml build |
This will take a while to build. In the meantime, we’ll start writing our Flask application. It’ll be a simple application that renders a Jinja template. In that template we’ll add the code to display the embedded dashboard. Let’s see what the template looks like.
1 | <title>Dashboard</title> |
Let’s unpack what’s going on. The embedded dashboard is rendered within an iframe and we need a container element to hold it. This is what the div is for; it’ll hold the iframe.
Next, we load the Superset embed SDK from the CDN. This make the supersetEmbededSdk variable globally available. We call the embedDashboard method on it to embed the dashboard. This method takes an object which contains the information needed for embedding. The first piece of informaton we pass is the id of the chart. As we’ll see shortly, we get this from the Superset UI. We’re using a template variable here and we’ll replace it with its actual value when we render the webpage.
Next, we specify the address of our Superset instance in the supersetDomain field. Here I’ve used the IP address of my local machine to point to the Docker containers running Superset.
Next, we specify the mount point. The mountPoint is the element within the page where the chart will be rendered. We’re retrieving the div using its ID.
Next, we specify the fetchGuestToken function. This function retrieves the guest token from the backend. Since we’re rendering the template from a Flask application, we’ll fetch the guest token on the servier side. Therefore, we simply return the guest token from the function. We’ve used a Jinja variable guest_token which we’ll replace with its actual value when we render the template.
Next, we specify some configuration information. In our example, we’ve hidden the title of the dashboard.
Finally, we increase the size of the iframe so that it fills the screen.
Having written the template, we’ll move on to writing the Flask web application. It’s a single file with one endpoint to render the chart. We’ll write functions to see how we can log into Superset using its API and then fetch a guest token. The complete code for the app is given below.
1 | from flask import Flask, render_template |
Let’s step through the code. The chart_id is the unique identifier for the chart we’re trying to embed. As we’ll see shortly, this comes from the Superset UI.
Next, we define the get_access_token function which retrieves an access token. To get this, we need to log into Superset. We use the default username and password which we POST to the login endpoint and extract the token from the JSON that’s returned. This token lets us fetch a guest token which is required for embedding the dashboard.
Next, we define the get_guest_token function which retrieves the guest token. It takes the ID of the user as an argument so that it can apply row-level security to the dataset that powers the dashboard. Row-level security, often abbreviated as RLS, is a mechanism which restricts a user’s access to only those rows that they have the permission to access. If we look at the view we’ve created, it contains the data for all the users. Applying row-level security allows us to display only those rows which pertain to the given user. The rls field in the JSON body contains the clause which limits the access of the user. It is applied as a part of the WHERE clause and filters the rows in the dataset. The resources field contains the ID of the chart that we’d like to embed. The user field contains the details of the guest user.
Next, we define the chart function which actually renders the tempalte. The template is rendered by calling the render_template function which takes the guest token and chart ID as arguments. This generates the final HTML which is returned to the user.
We’ll run this app in a separate terminal by executing the following command.
1 | python run_app.py |
After waiting for a while to let the Superset images build, we can go ahead and bring up its containers.
1 | TAG=4.1.1 docker compose -f docker-compose-non-dev.yml up -d |
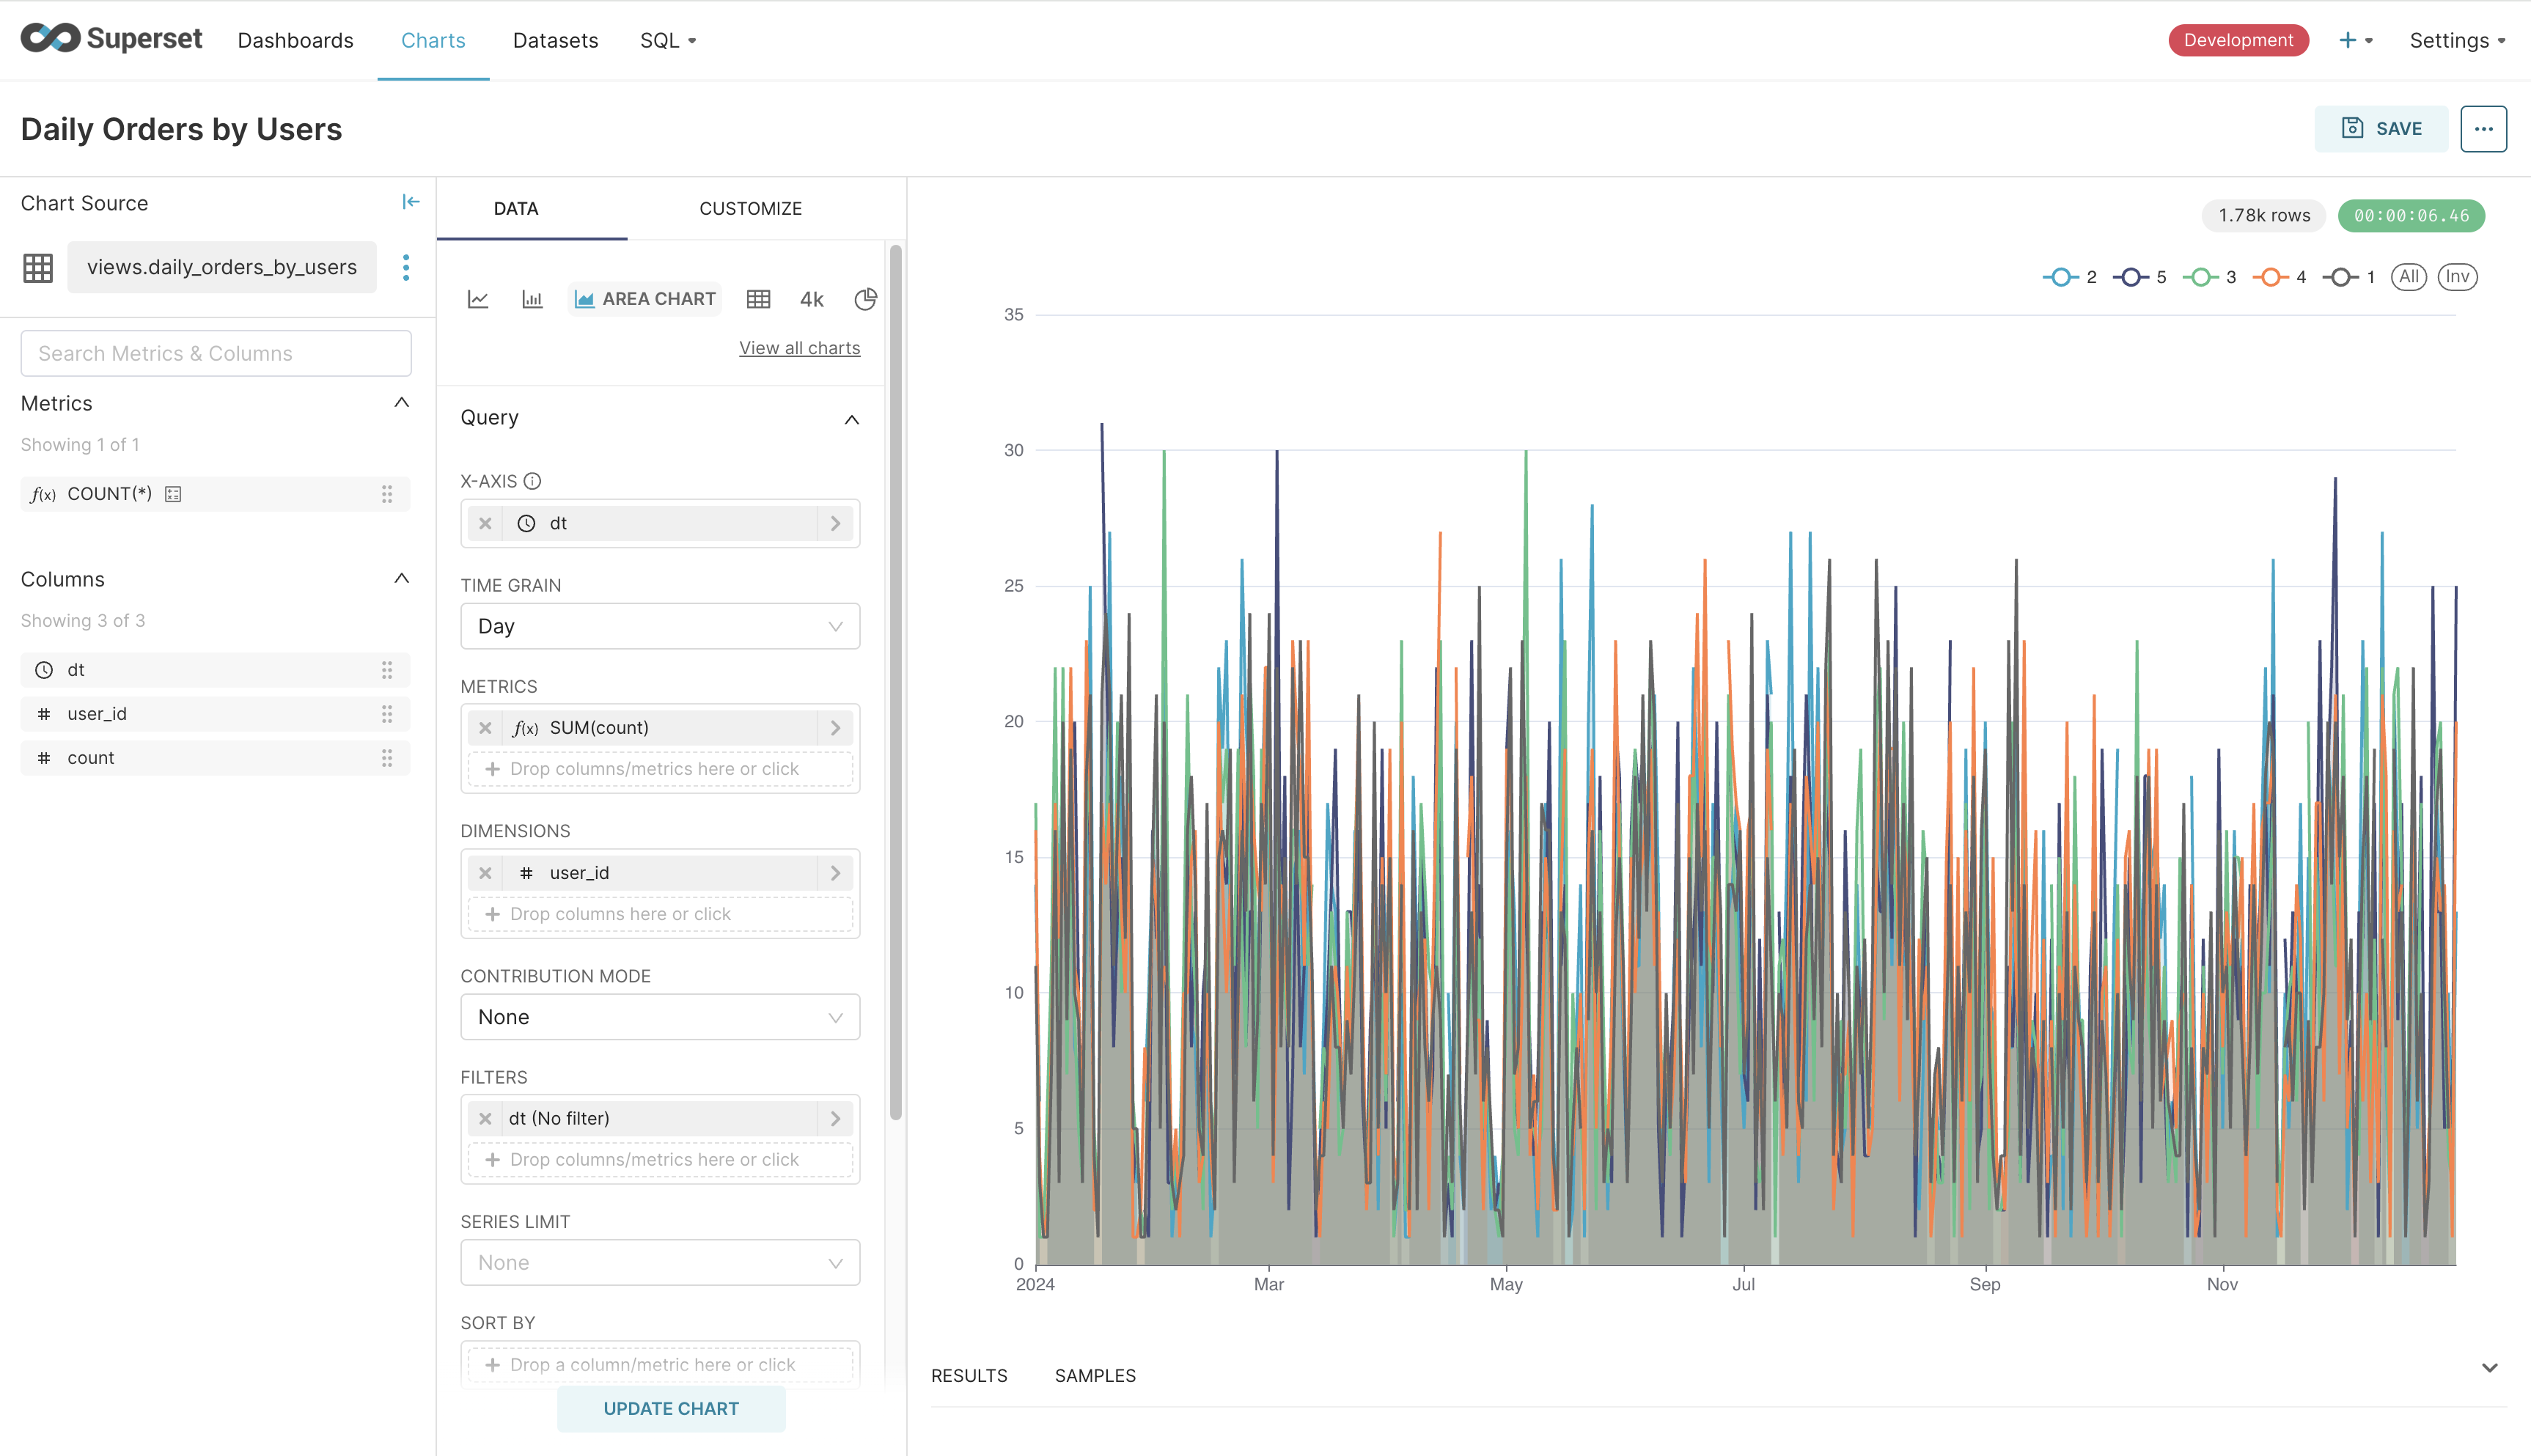
After opening the Superset UI, we’ll begin by creating a dashboard. We’ll add a chart to the dasboard which is backed by the daily_orders_by_users view which we created earlier. We’ll add an area chart where we have date on the x-axis and the count on the y-axis with the ID of the user being the dimension. The screenshot below shows what it looks like.

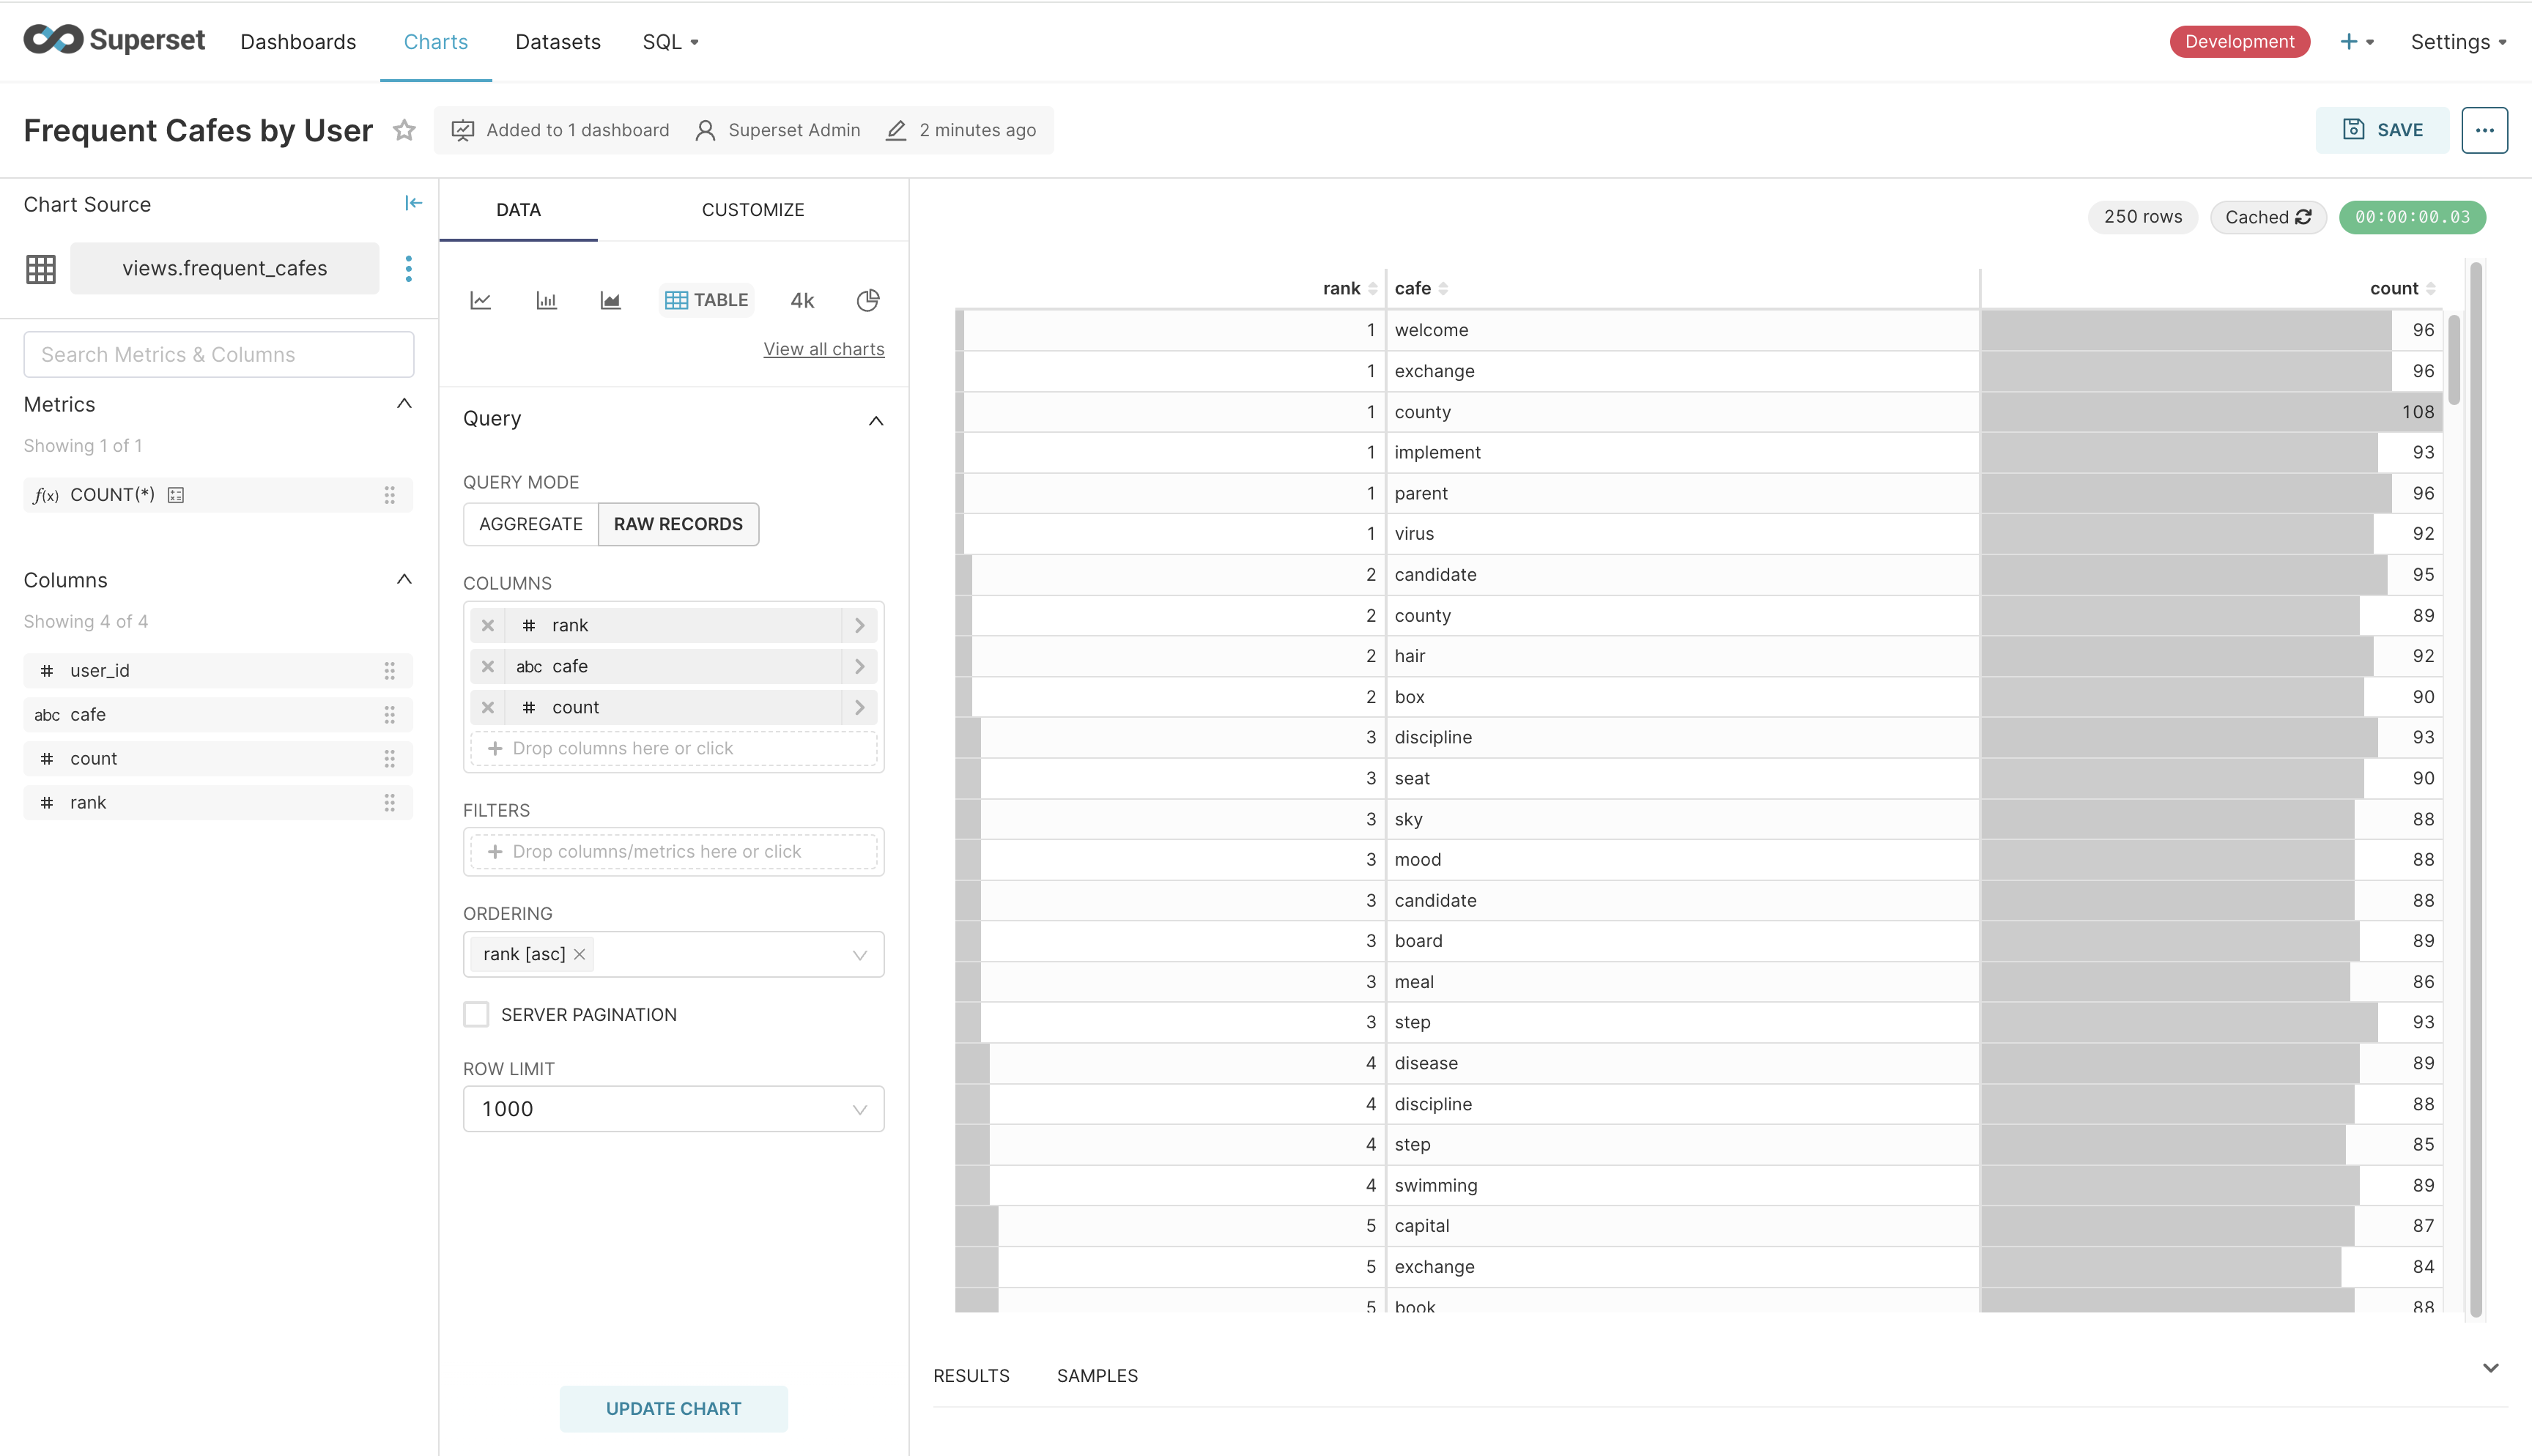
The chart looks cluttered because it is displaying the data of every user. When we embed this chart, we’ll rely on row-level security to display the chart that only belongs to a particular user. Similarly, we’ll add a table backed by the frequent_cafes view and display it in the dashboard. Remember that the filtering is applied to the dataset backing the chart. This means that we can create the table and exclude the user_id column from display.

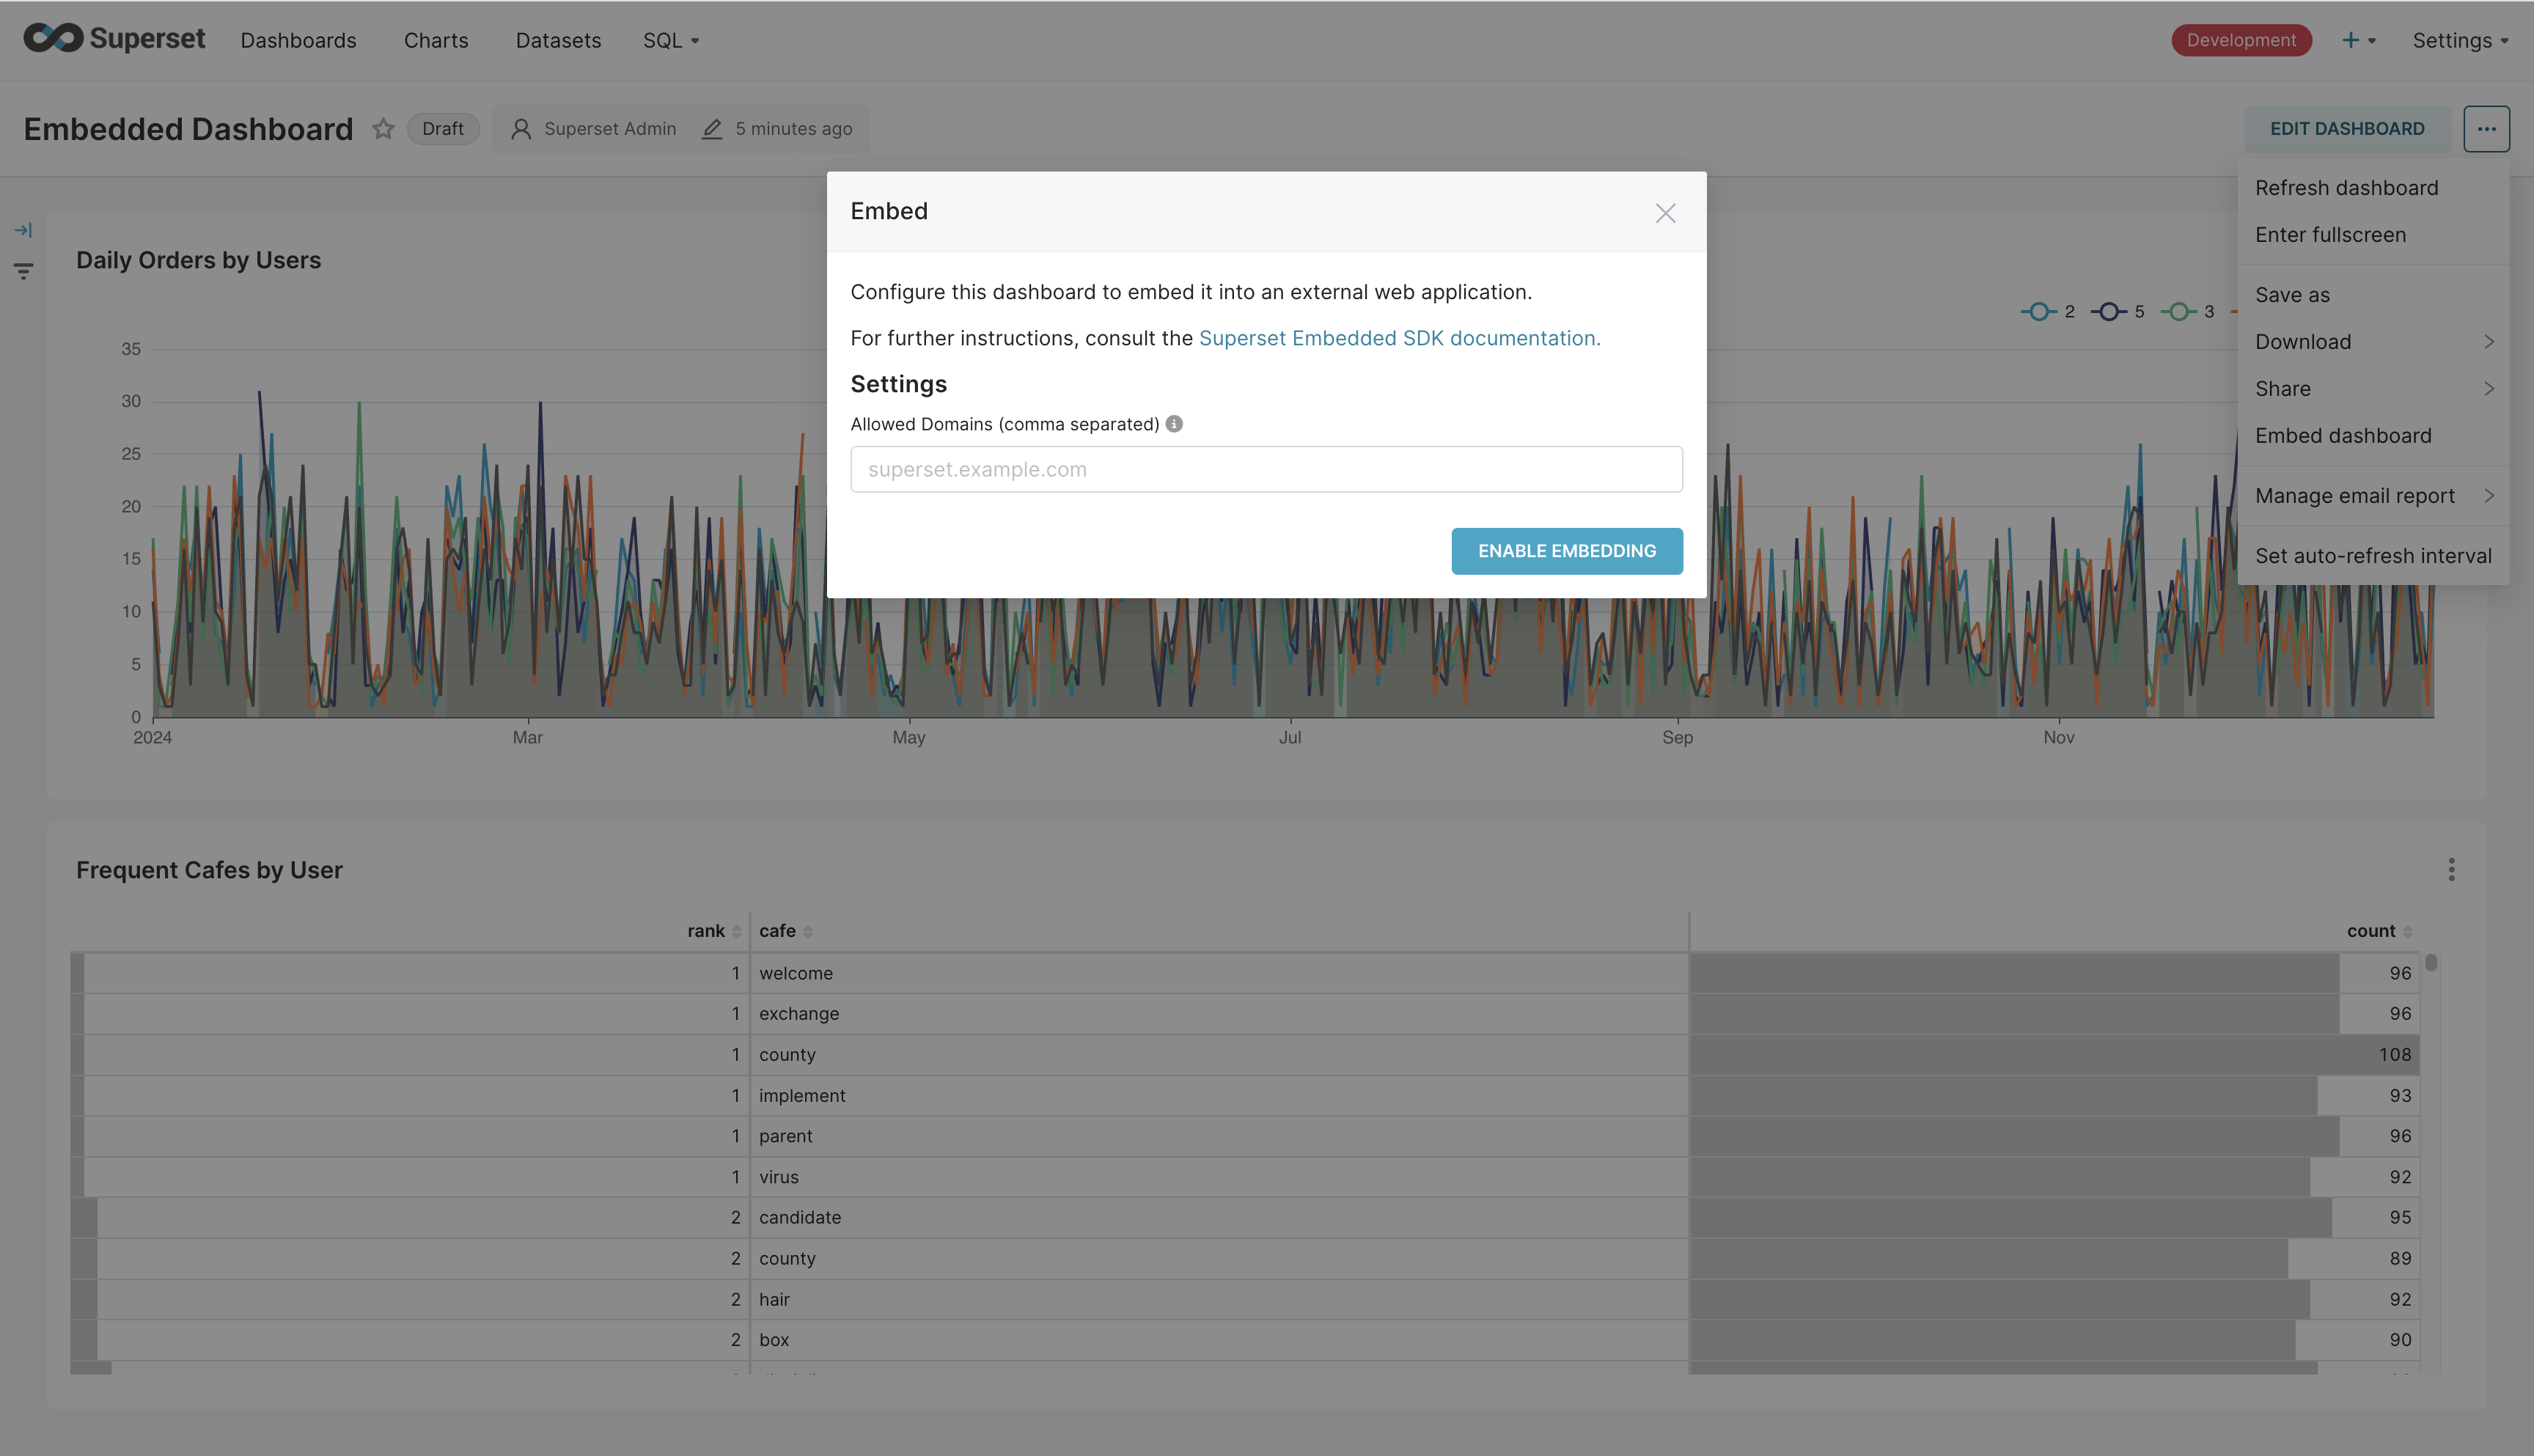
Having added all our charts to the dashboard, we can embed it in the webapp. Begin by saving the dashboard. Then, click on the three dots on the top-right hand and click “Embed dashboard”. You should see a dialog box pop up which allows you to list the domains from which the embedded dashboard can be accessed. We’ll leave this empty to allow embedding from all domains and click “Enable Embedding”. From the next dialog box, we’ll copy the ID of the dashboard and then click the X button on the top-right hand to close it.

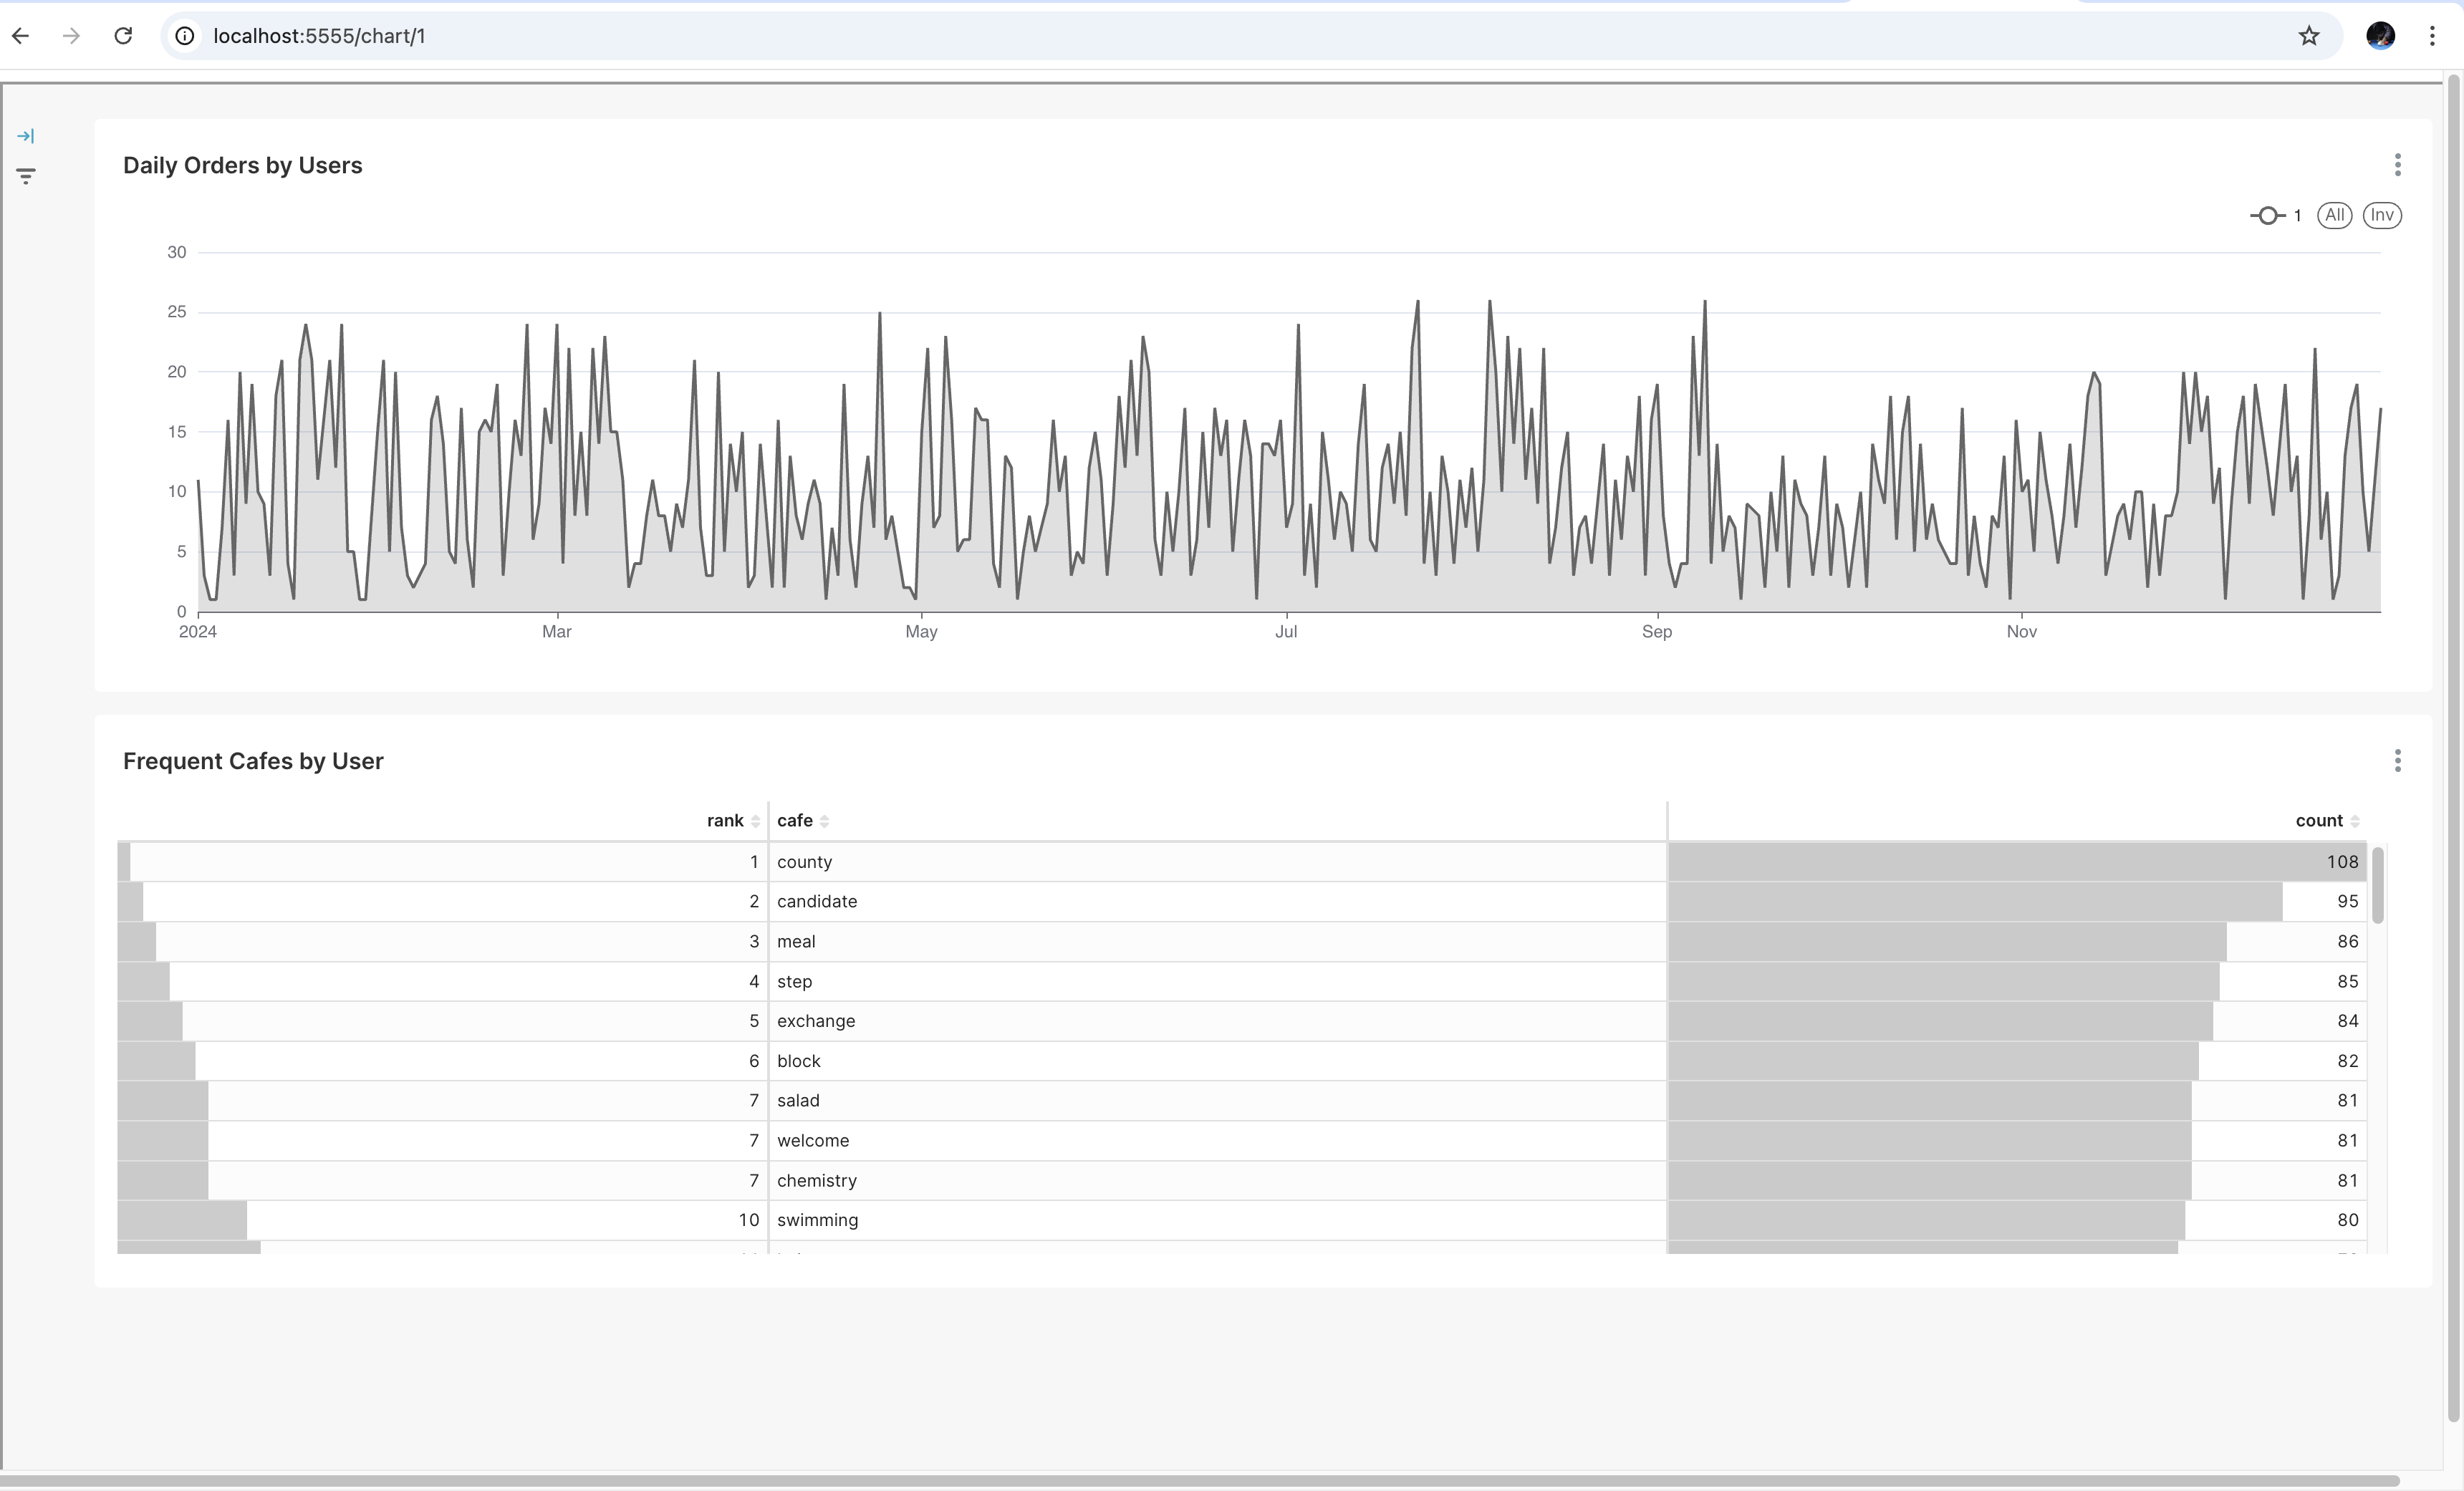
We’ll replace the chart_id variable in our web application and then run it. It will start a Flask application that listens on port 5555. We’ll navigate to http://localhost:5555/1 which will display the chart and the table for the user with ID 1. The embedded dashboard will apply the row-level security clause for this user ID and only display their data. The dashboard looks as follows.

That’s it. That’s how to embed a Superset dashboard.