I’d previously written about creating a data platform using Pinot, Trino, Airflow, and Debezium. It was a quick how-to that showed how to glue the pieces together to create a data platform. In this post we’ll go deeper into the design of the system and look at building the system in the posts that follow.
The design
A common requirement for data engineering teams is to move data stored within the databases owned by various microservices into a central data warehouse. One of the ways to move this data is by loading it incrementally. In this approach, once the data has been loaded fully, subsequent loads are done in smaller increments. These contain rows that have changed since the last time the warehouse was loaded. This brings the data into the warehouse periodically as the loads are run on a specified schedule.
Recently the shift has been towards moving data in realtime so that analytics can be derived quickly. Change data capture allows capturing row-level changes as they happen as a result of inserts, updates, and deletes in the tables. Responding to these events allows us to load the warehouse in realtime.
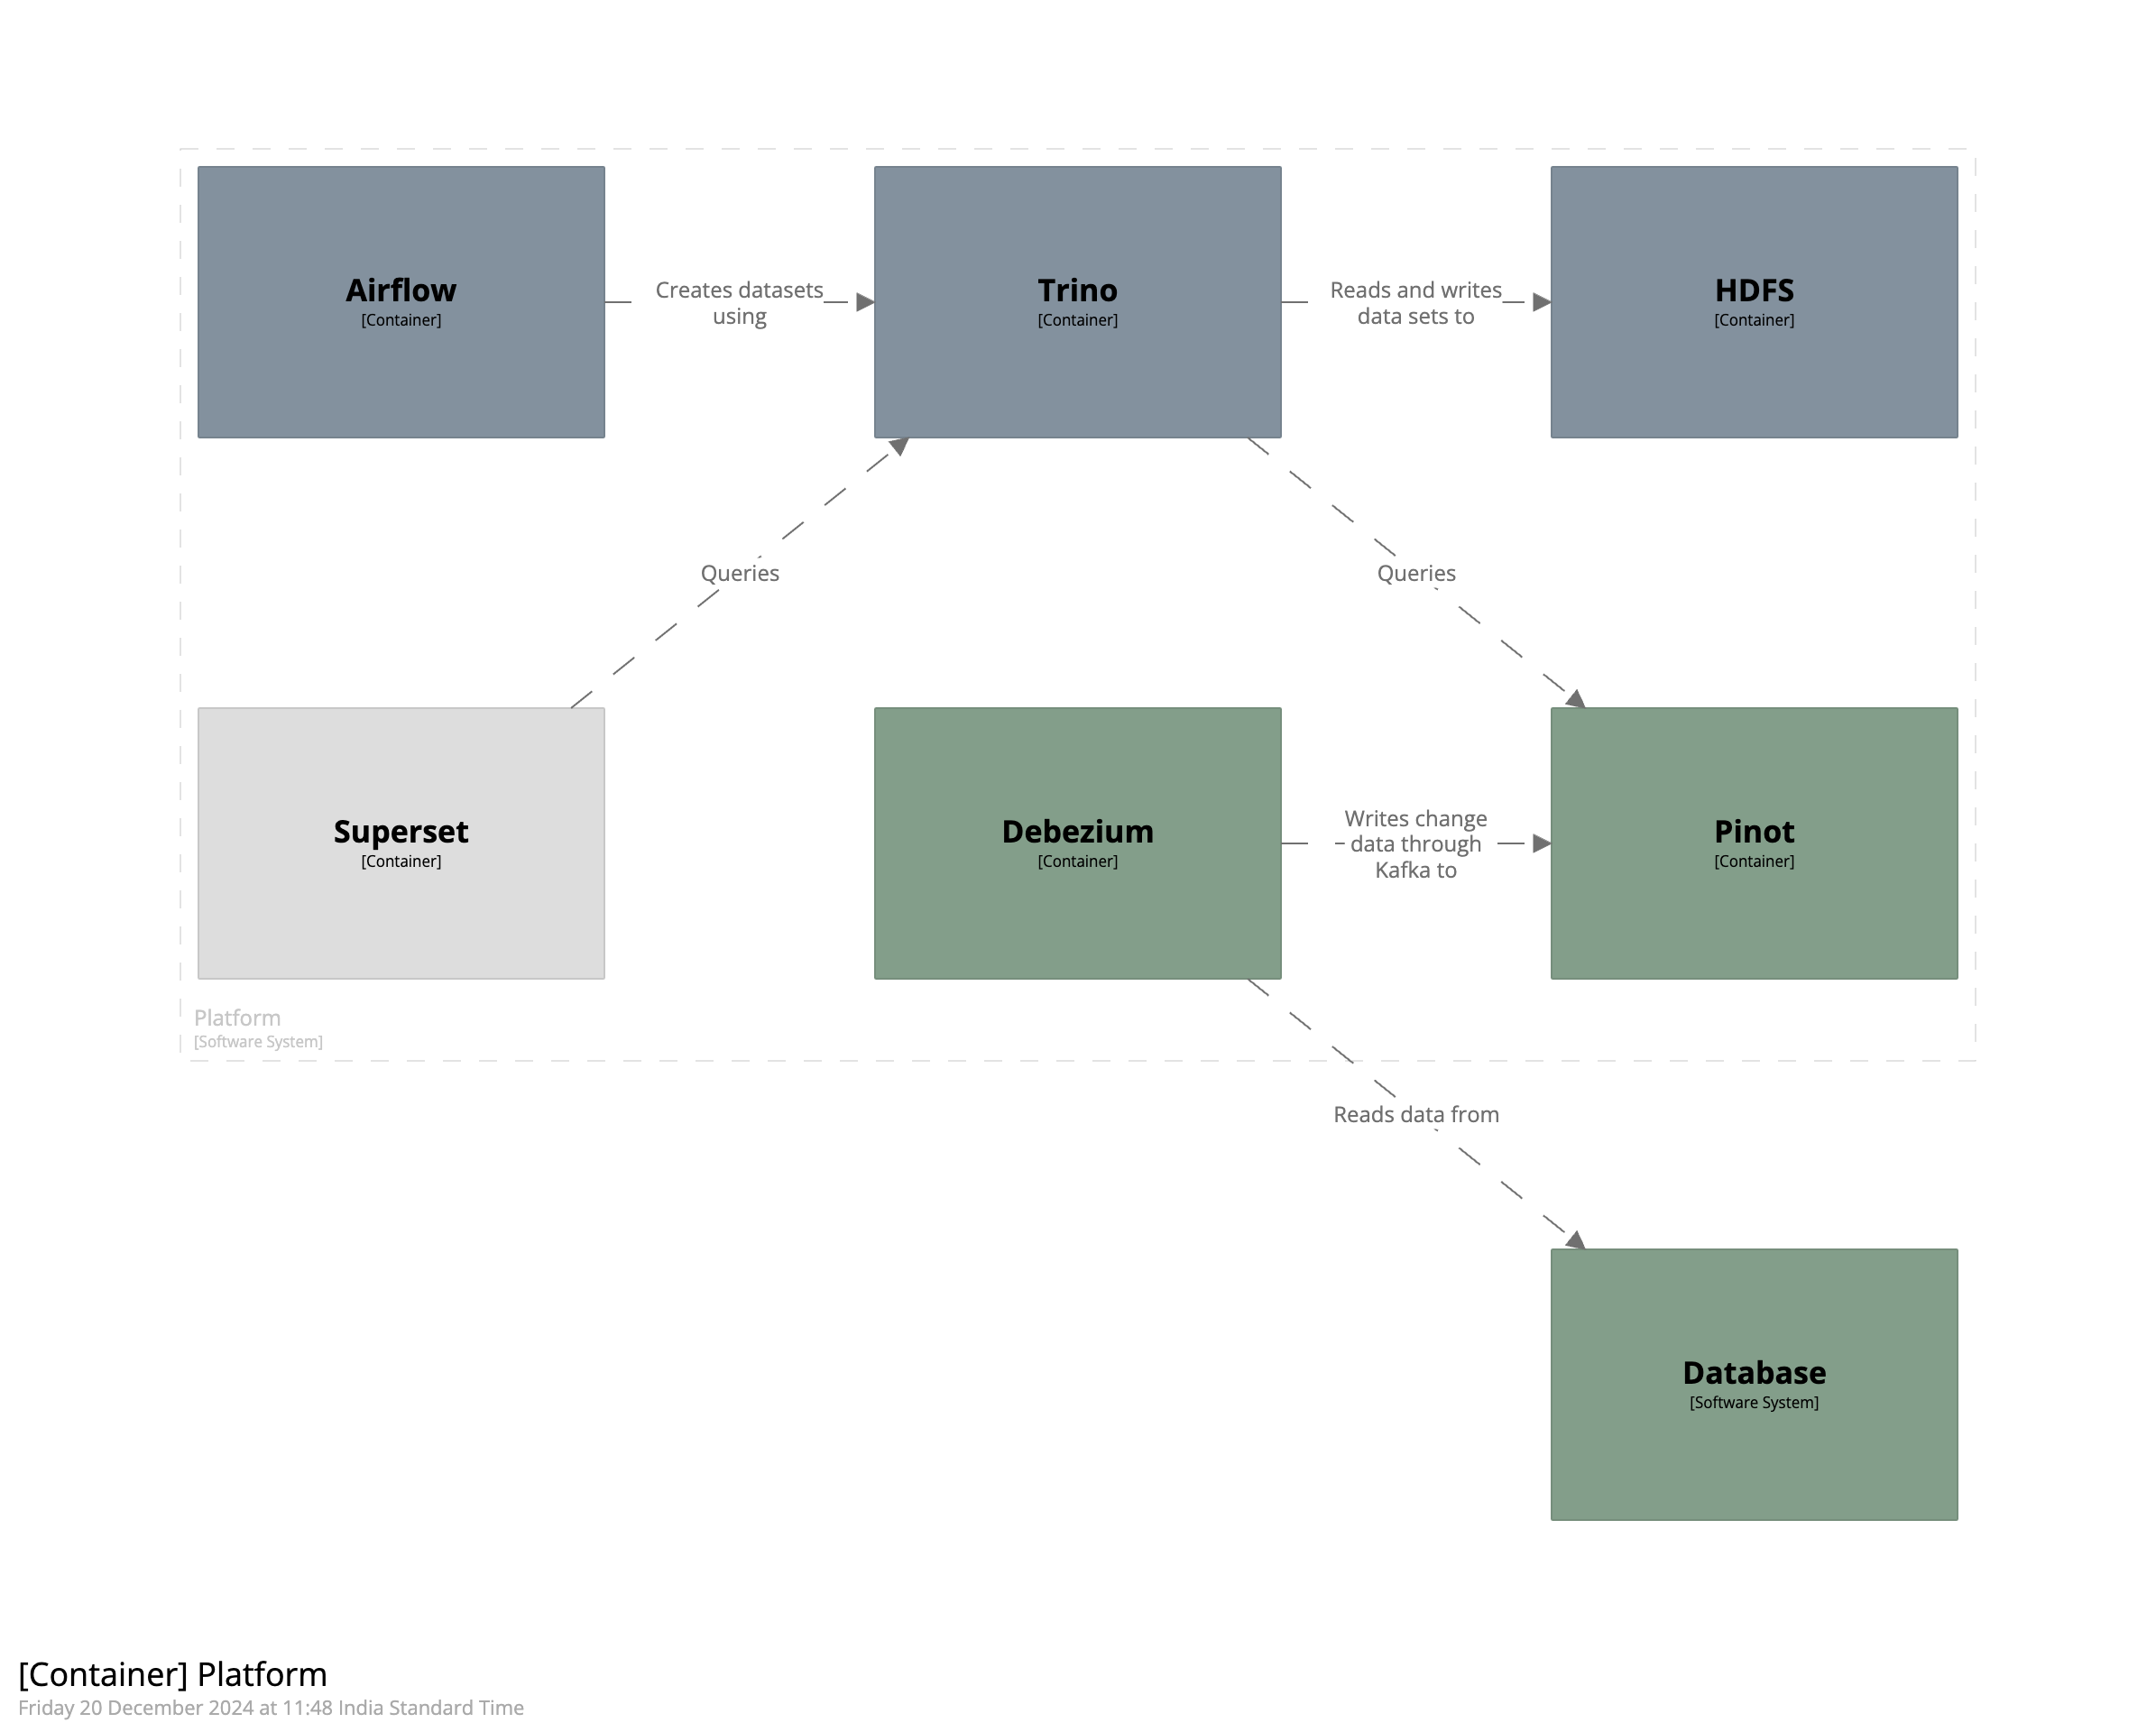
The diagram below shows how we can combine Pinot, Trino, Airflow, Debezium, and Superset to create a realtime data platform.

The components of the system can be divided into three broad categories. The first category is those that bring data into the platform and are shown in dark green. This category consists of the source database system, Debezium, and Pinot. Debezium reads the stream of changes happening in the database and writes them into Pinot. The second category is those that create datasets on top of the data ingested into Pinot and are shown in dark grey. This category consists of Airflow, Trino, and HDFS. Airflow uses Trino to create tables and views in HDFS on top of the data stored in Pinot. Finally, the last category is those that consume the datasets and present them to the end user. This category consists of data visualization tools like Superset.
Let’s discuss each of these components in more detail.
Debezium is a platform for change data capture. It consists of connectors which monitor the database tables for inserts, updates, and deletes and emit events into Kafka. These events can then be written into the data warehouse to create an up-to-date version of the table in the upstream database. We’ll run Debezium as a Docker container. When run like this, the connectors are available as a part of the image and can be configured using a REST API. To configure the connector we’ll send a JSON object to a specific endpoint. This object contains information such as the credentials of the database, the databases or tables we’d like to monitor, any transformations we’d like to apply to this data, and so on. As we’ll see when we begin building the system, we can monitor all of our tables for changes happening in them.
Pinot is an OLAP datastore that is built for real-time analytics. It supports creating tables that consume data in realtime so that insights can be derived quickly. Pinot, when combined with Debezium, allows us to ingest row-level changes as they happen in the source table. Configurations for Pinot tables and schemas are written in JSON and sent to their respective endpoints to create them. We’ll create a realtime table which ingests events emitted by Debezium. Using the upsert functionality provided by Pinot, we’ll keep only the latest state of the row in the table. This makes it easier to to create reports or do ad-hoc analysis.
Trino provides query federation by allowing us to query multiple data sources with a unified SQL interface. It is fast and distributed which means we can use it to query large amounts of data. We’ll use it in conjunction with Pinot since the latter does not yet provide full SQL capabilities. Trino allows connecting to a database by creating a catalog. As we can see from the diagram, we’ll need two catalogs - Pinot and HDFS. Since it is currently not possible to create views, materialized views, or tables from select statements in Pinot, we’ll create them in HDFS using Trino. This allows us to speed up the reports and dashboards since all of the required data will be precomputed and available in HDFS as either a materialized view or a table.
Airflow is an orchestrator that allows creating complex workflows. These workflows are created as Python scripts that define a directed acyclic graph (DAG) of tasks. Airflow then schedules these tasks for execution at defined intervals. Tasks are defined using operators. For example, to execute a Python function one would use the PythonOperator. Similarly, there are operators to execute SQL queries. We’ll use these operators to query Trino and create the datasets that are needed for reporting and dashboards. Peridocially regenerating these datasets would allow us to provide reports that present the latest data.
Superset is a data visualization tool. We’ll connect Superset to Trino so that we can visualize the datasets that we’ve created in HDFS.
Having discussed the various components of the design, let’s look at the design goals it achieves. First, the system is designed to be realtime. With change data capture using Debezium, we can respond to every insert, update, and delete happening in the source table as soon as it happens. Second, the system is designed with open-source technologies. This allows us to benefit from the experience of the collaborators and community behind each of these projects. Finally, the system is designed to be as close to self-service as possible. As we’ll see, the design of the system reduces the dependency of the of the downstream business analytics and data scientist teams on the data engineering team significantly.
This is it for the first part of the series.