In a previous post we’d seen how to create a realtime data platform with Pinot, Trino, Airflow, and Debezium. In this post we’ll see how to setup a data catalog using DataHub. A data catalog, as the name suggests, is an inventory of the data within the organization. Data catalogs make it easy to find the data within the organisation like tables, data sets, reports, etc.
Before we begin
My setup consists of Docker containers required to run DataHub. While DataHub provides features like data lineage, column assertions, and much more, we will look at three of the simpler featuers. One, we’ll look at creating a glossary of the terms that will be used frequently in the organization. Two, we’ll catalog the datasets and views that we saw in the previous post. Three, we’ll create an inventory of dashboards and reports created for various departments within the organisation.
The rationale for this as follows. Imagine a day in the life of a business analyst. Their responsibilities include creating reports and dashboards for various departments. For example, the marketing team may want to see an “orders by day” dashboard so that they can correlate the effects of advertising campaigns with an uptick in the volume of orders. Similarly, the product team may want a report of which features are being used by the users. The requests of both of these teams will be served by the business analyts using the data that’s been brought into the data platform. While they create these reports and dashboards, it’s common for them to receive queries asking where a team member can find a certain report or how to interpret a data point within a report. They may also have to search for tables and data sets to create new reports, acquaint themselves with the vocabulary of the various departments, and so on.
A data catalog makes all of this a more efficient process. In the following sections we’ll see how we can use DataHub to do it. For example, we’ll create the definition of the term “order”, create a list of reports created for the marketing department, and bring in the views and data sets so that they become searchable.
The work of data scientists is similar, too, because they create data sets that can be reused across various models. For example, data sets representing features for various customers can be stored in the platform, made searchable, and used with various models. They, too, benefit from having a data catalog.
Finally, it helps bring people up to speed with the data that is consumed by their department or team. For example, when someone joins the marketing team, pointing them to the data catalog helps them get productive quickly by finding the relevant reports, terminology, etc.
Ingesting data sets and views
To ingest the tables and views, we’ll create a data pipeline which ingets metadata from AWS Glue and writes it to the metadata service. This is done by creating a YAML configuration in DataHub that specifies where to ingest the metadata from, and where to write it. Once this is created, we can schedule it to run periodically so that it stays updated with Glue.
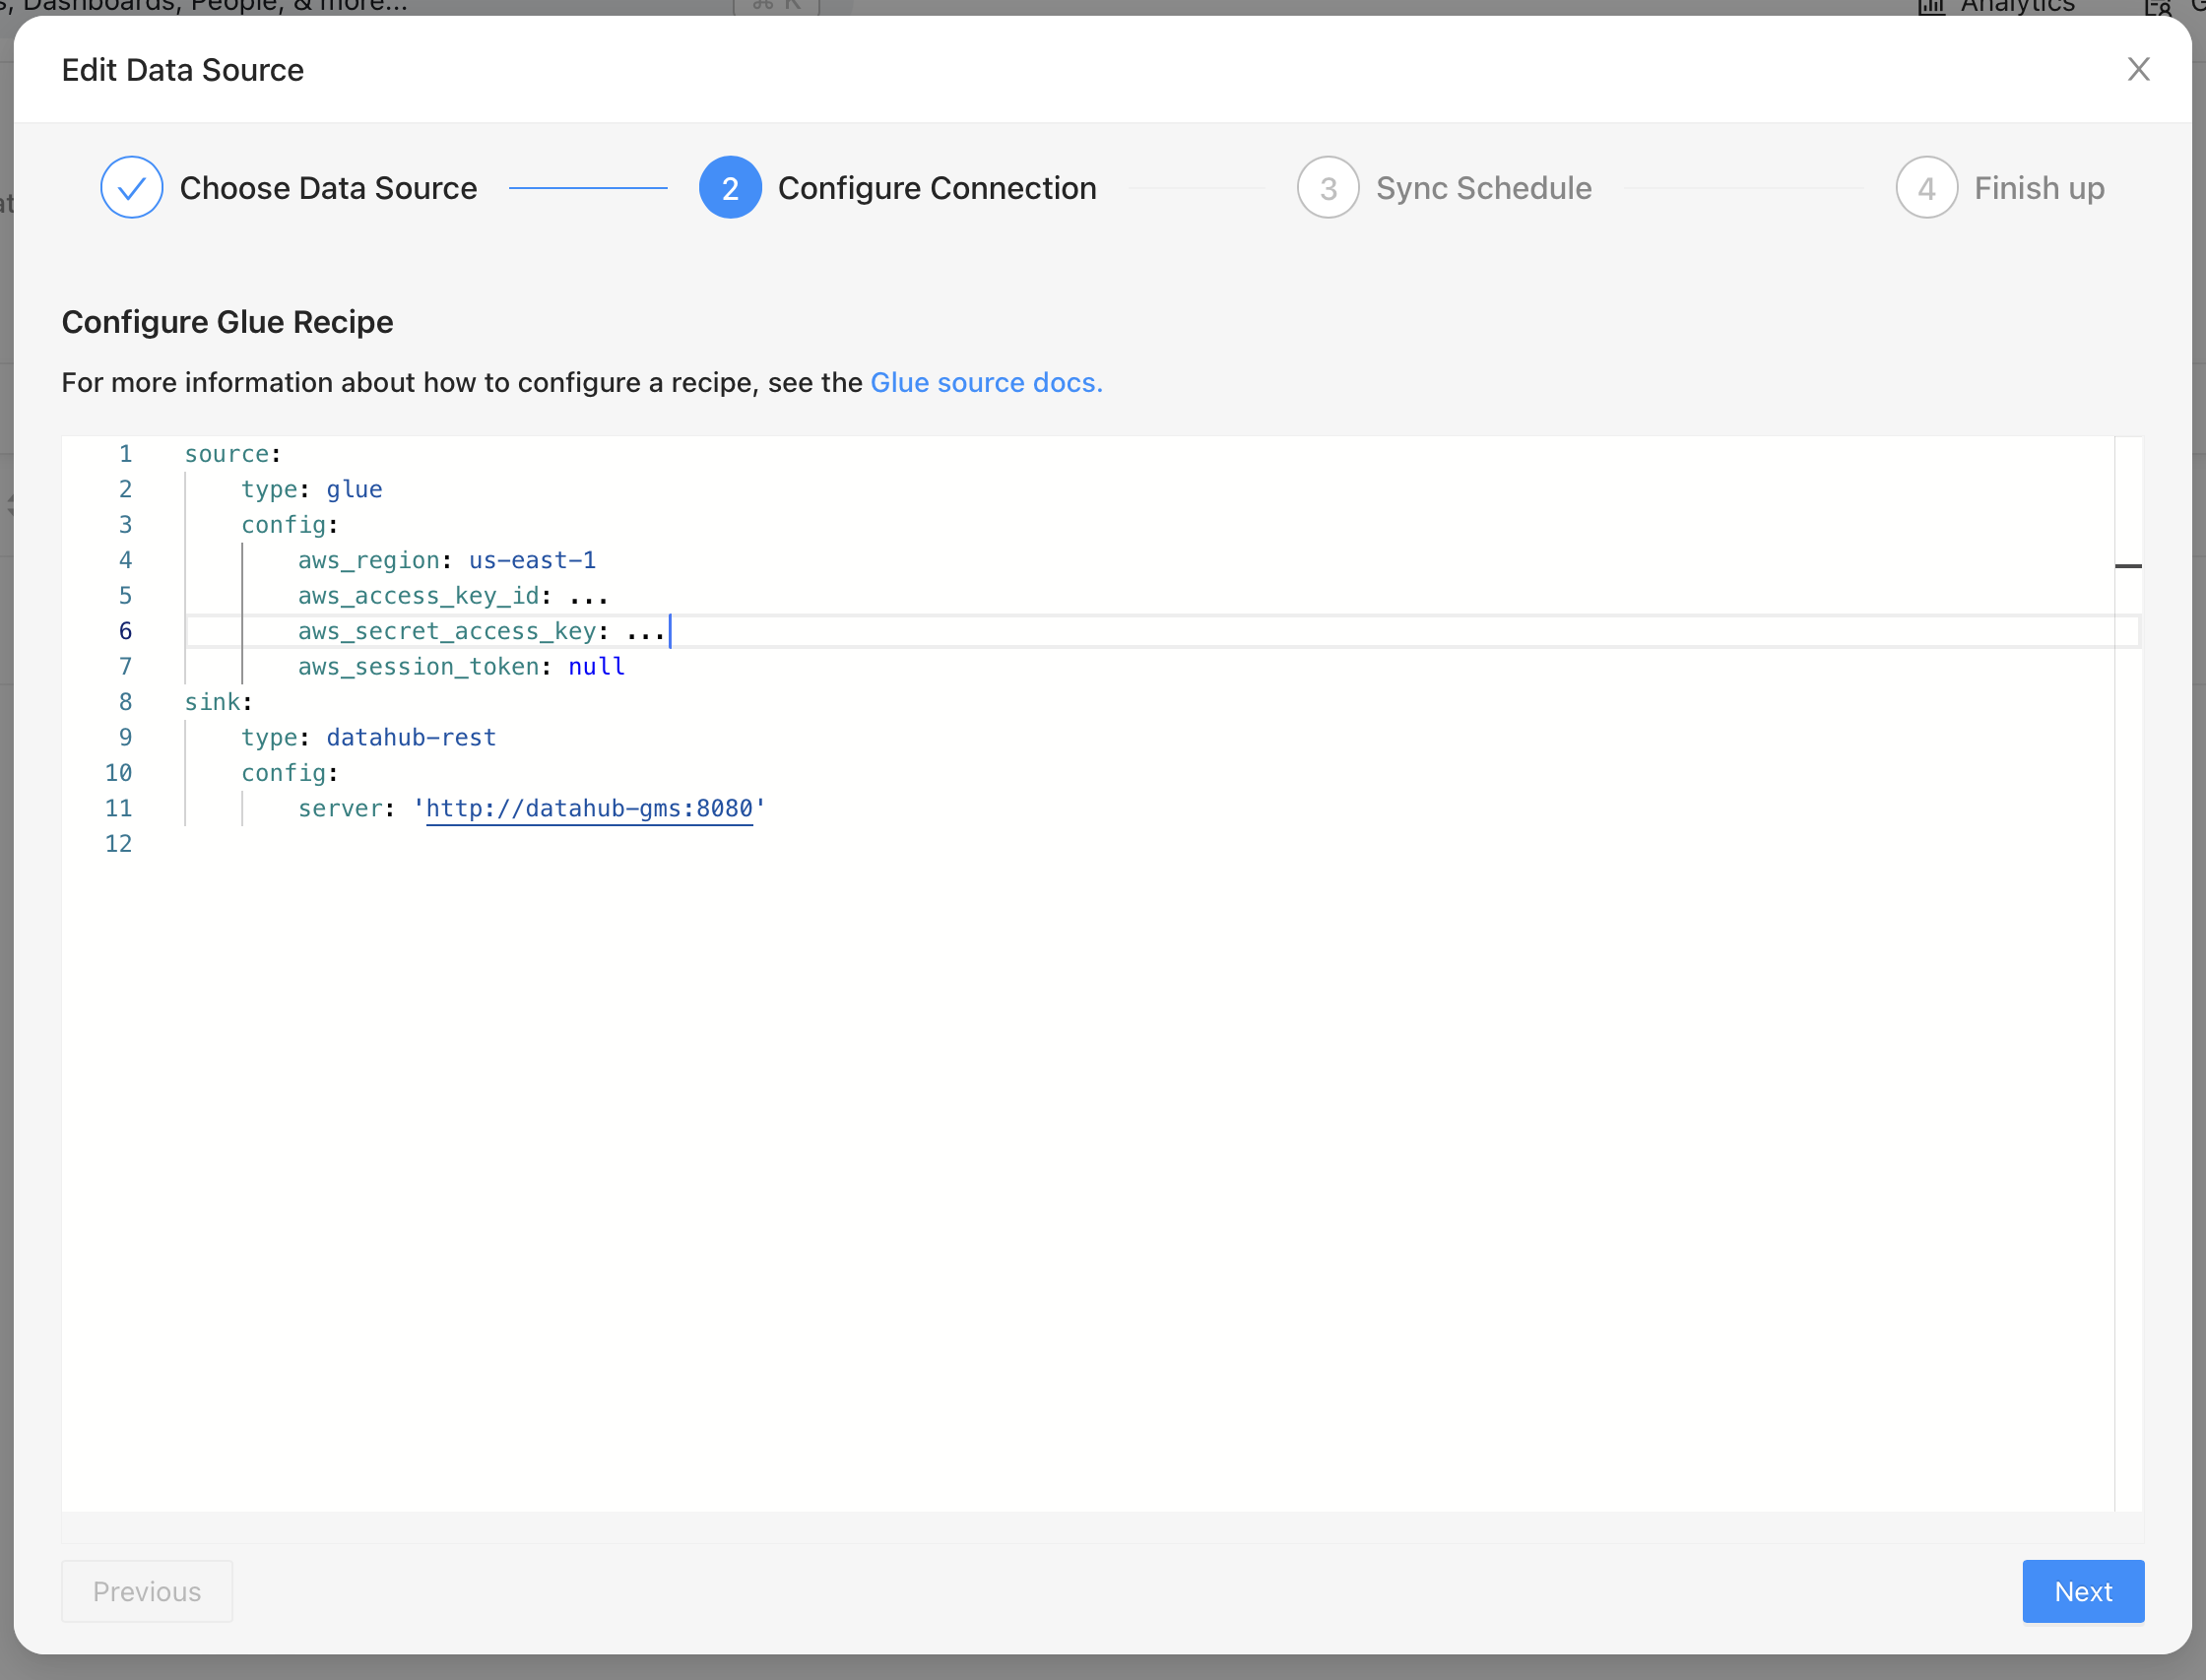
The image above shows how we define a “source” and how we ingest it into a “sink”. Here we’ve specified that we’d like to read from Glue and write it to DataHub’s metadata service.
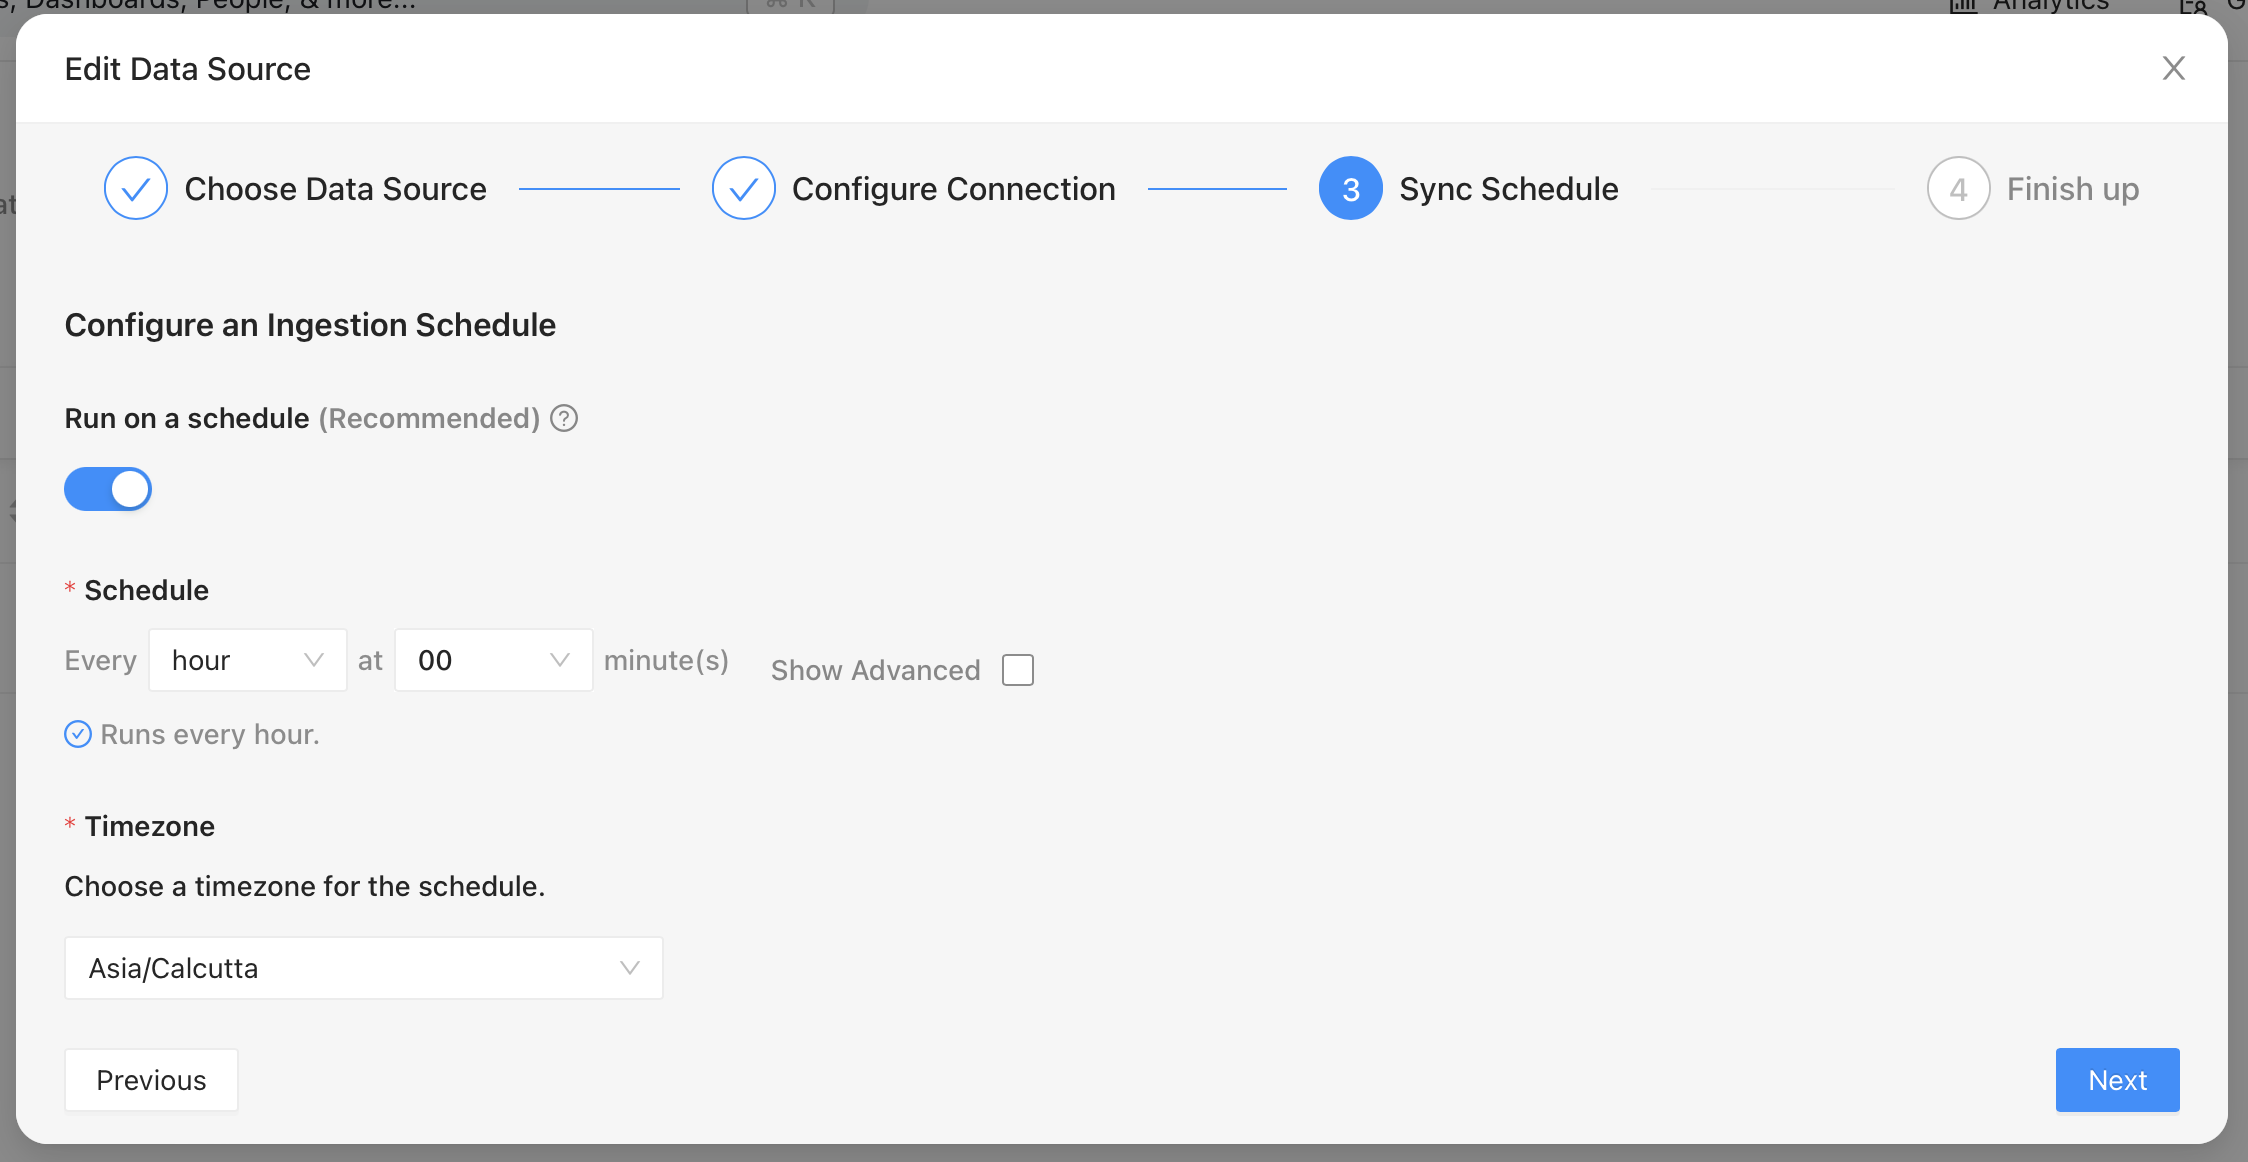
Once the source and destination are defined, we can set a schedule to run the ingestion. This will bring in the metadata about the data sets and views we’ve created in Glue.
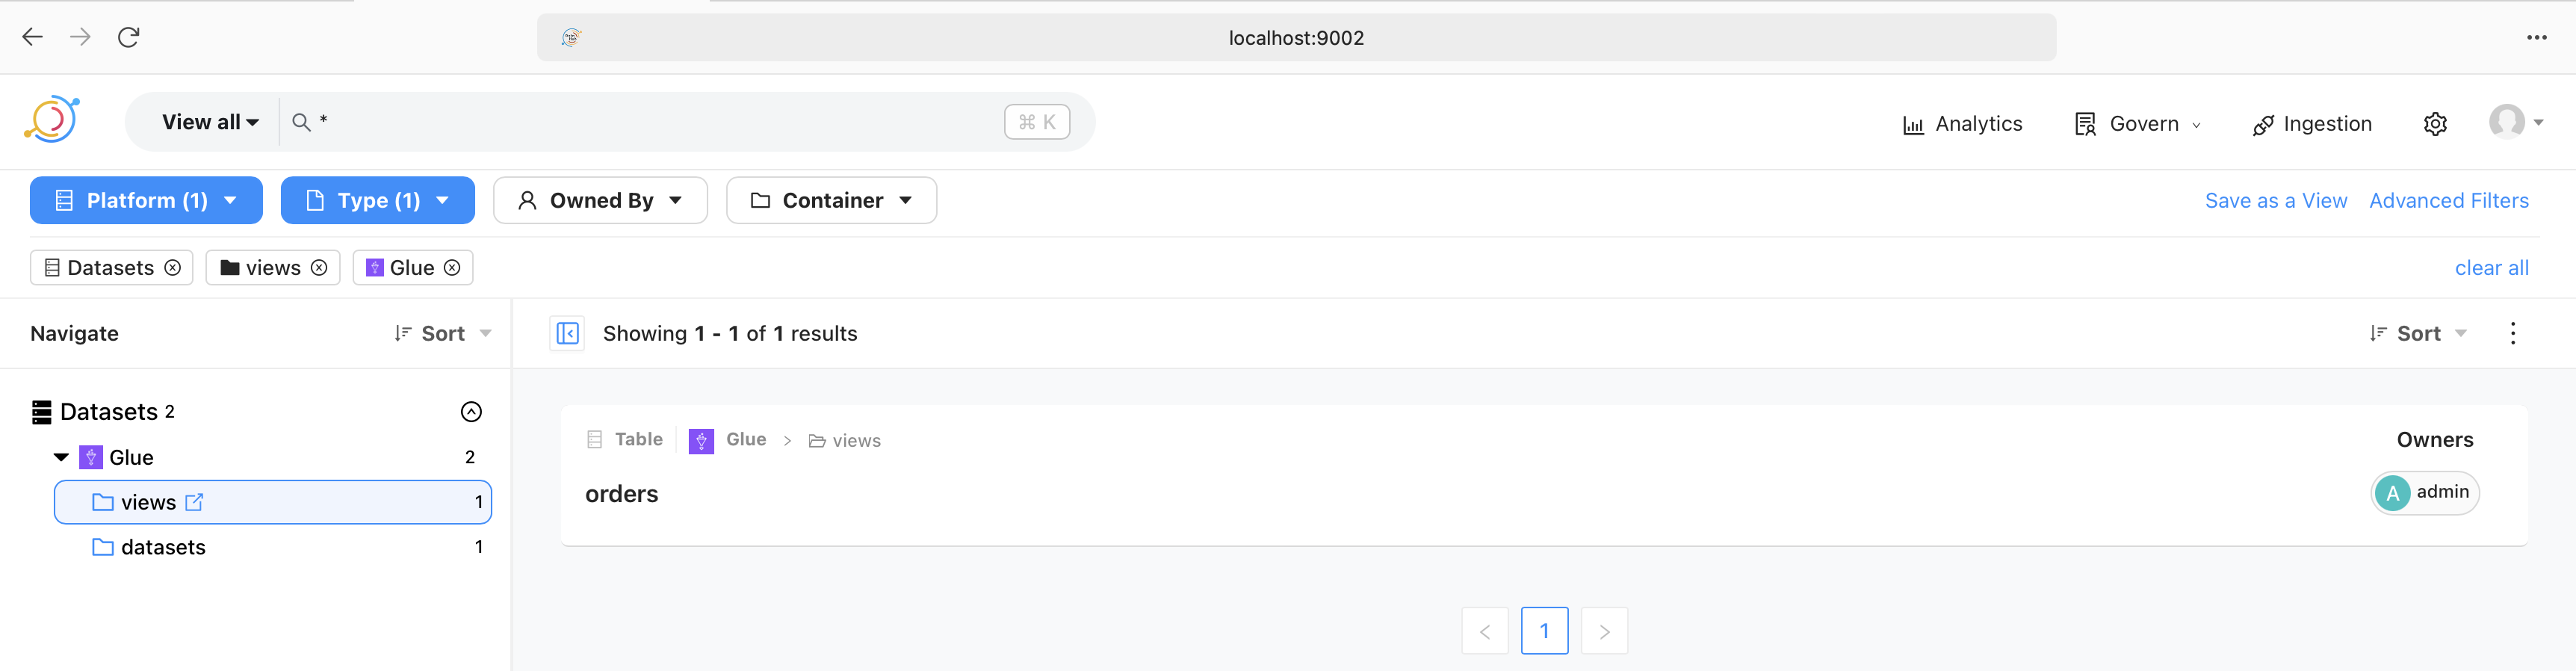
The image above shows that a successful run of the ingestion pipeline brings in the views and data sets. These are then browsable in the UI. Similarly, they are also searchable as shown in the following image.
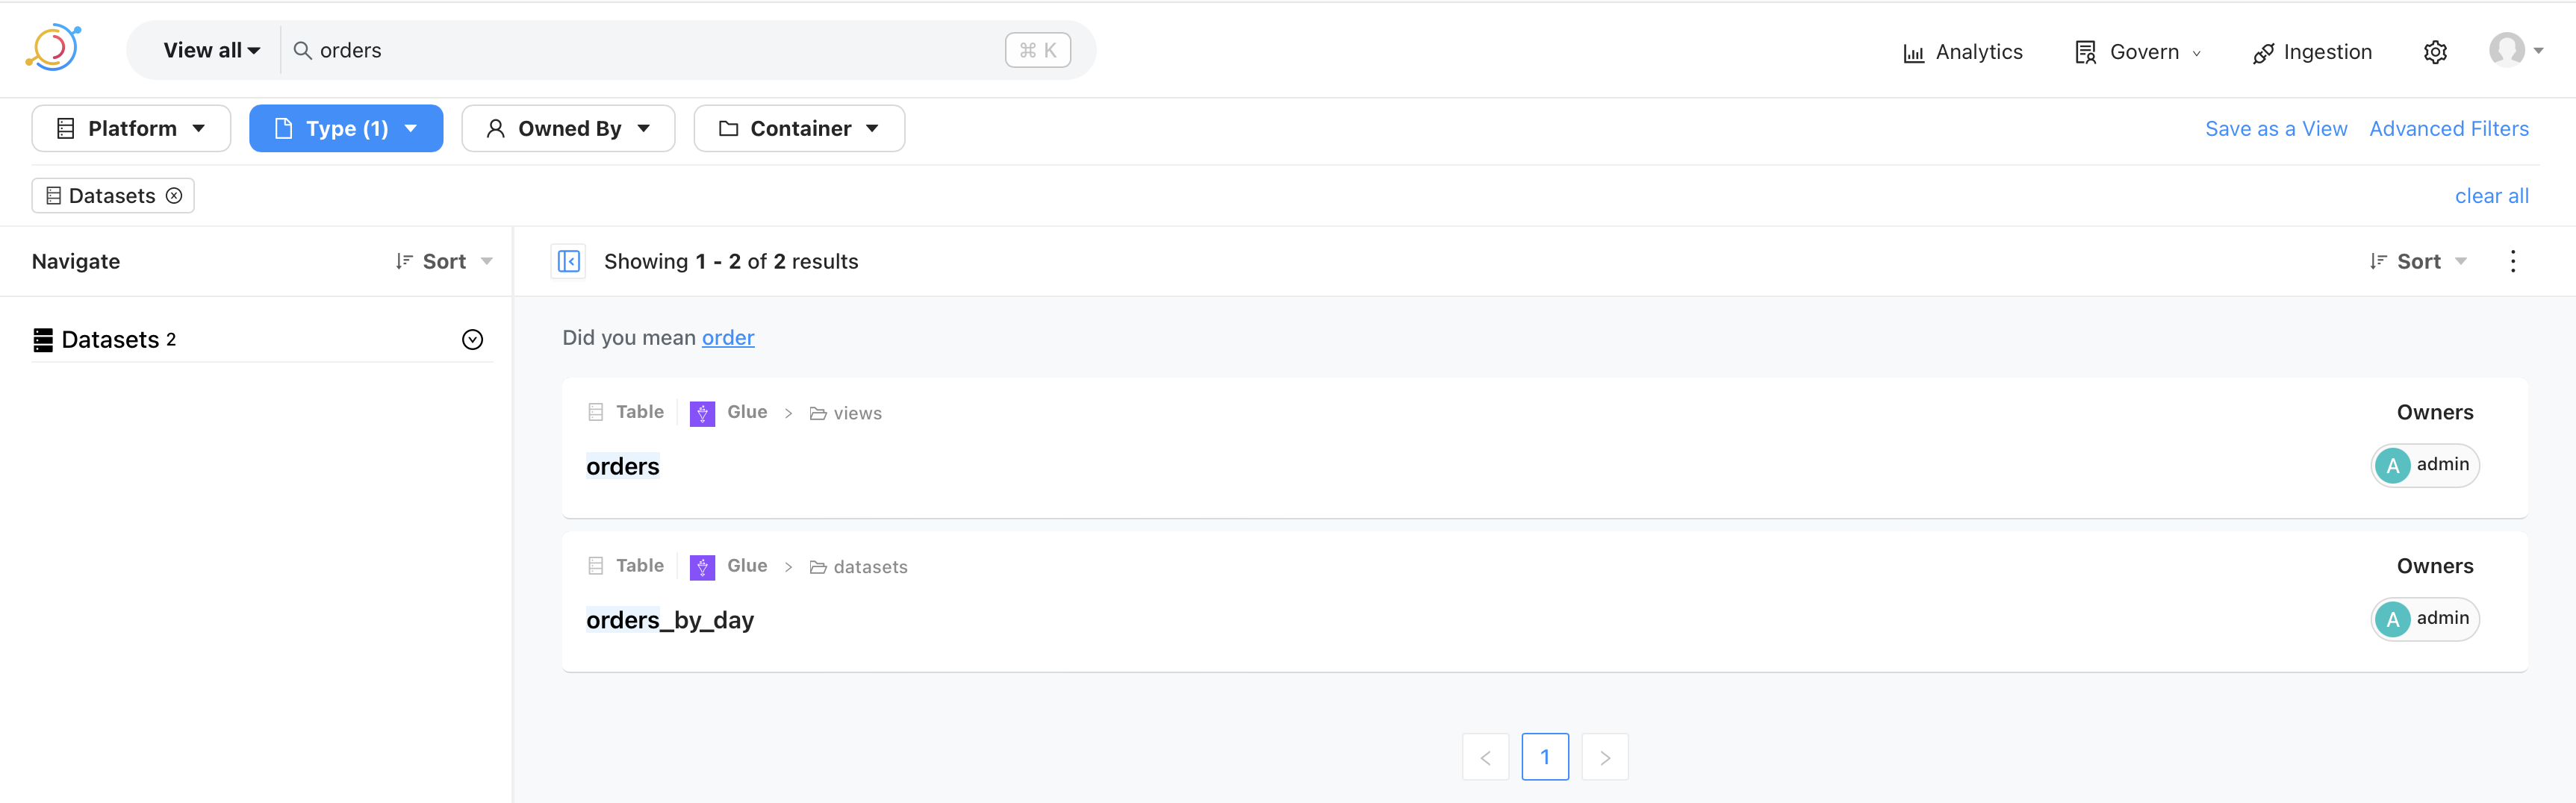
This makes it possible for the analysts and the data scientists to quickly locate data sets.
Defining the vocabulary
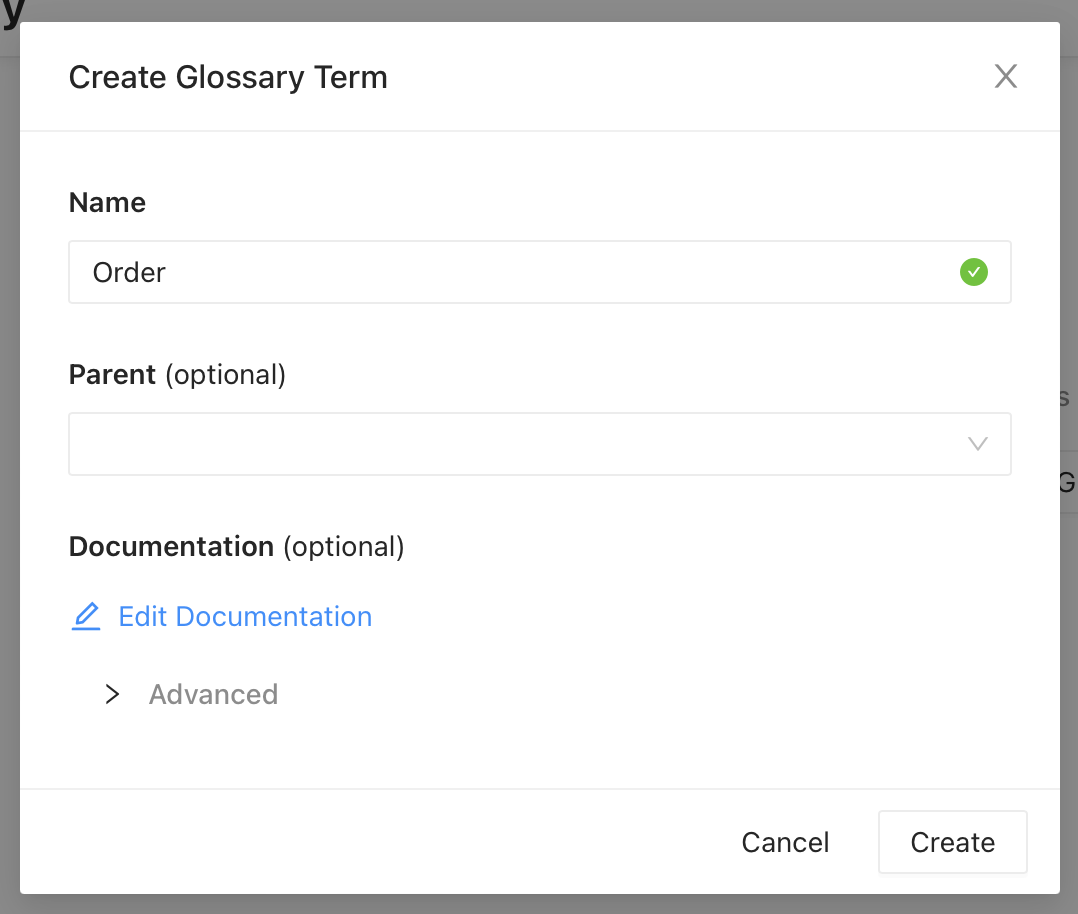
Next, we’ll create the definition of the word “order”. This can be done from the UI as shown below. The definition can be added by editing the documentation.
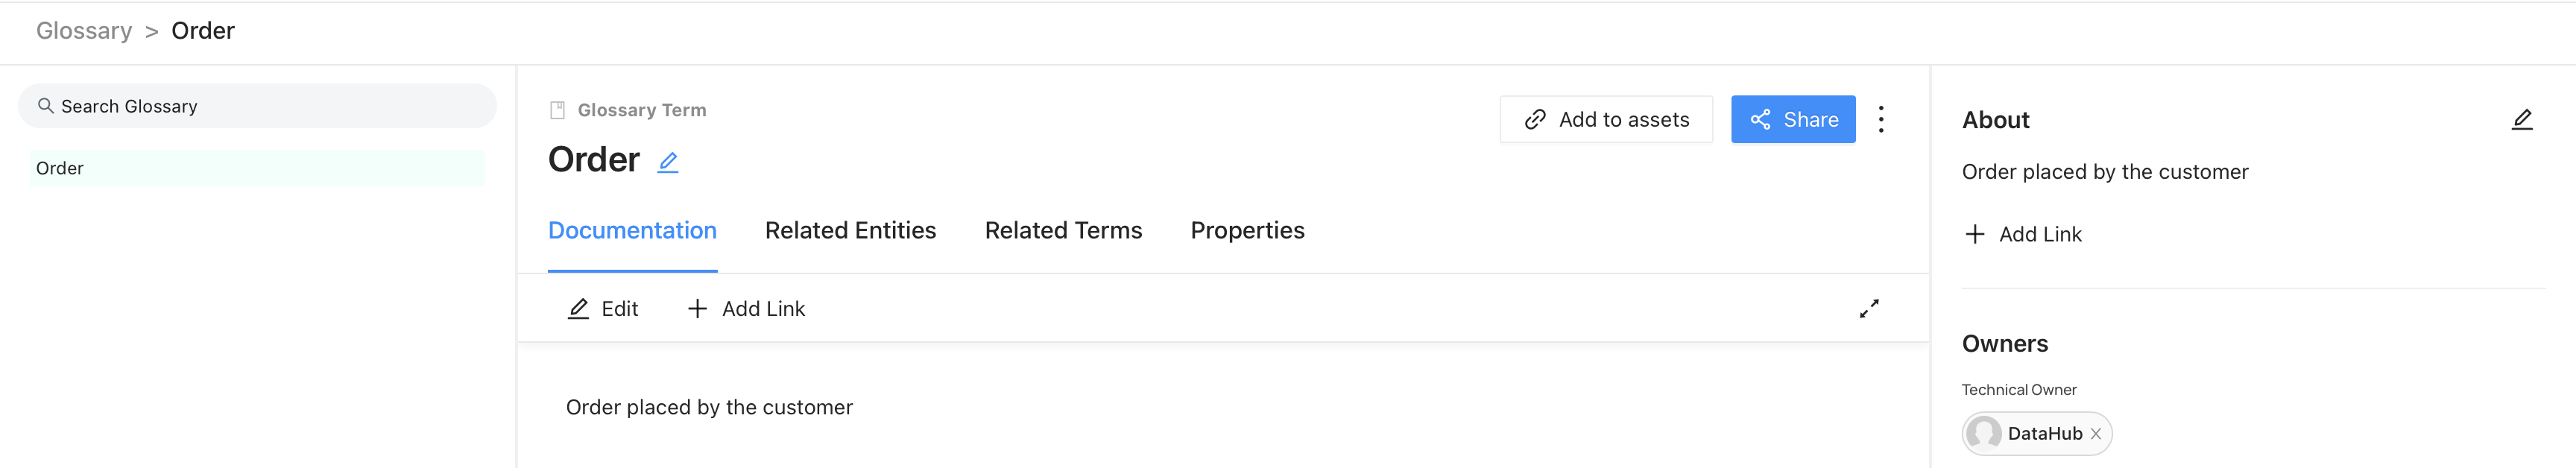
Once created, this is available under “Glossary” and in search results.
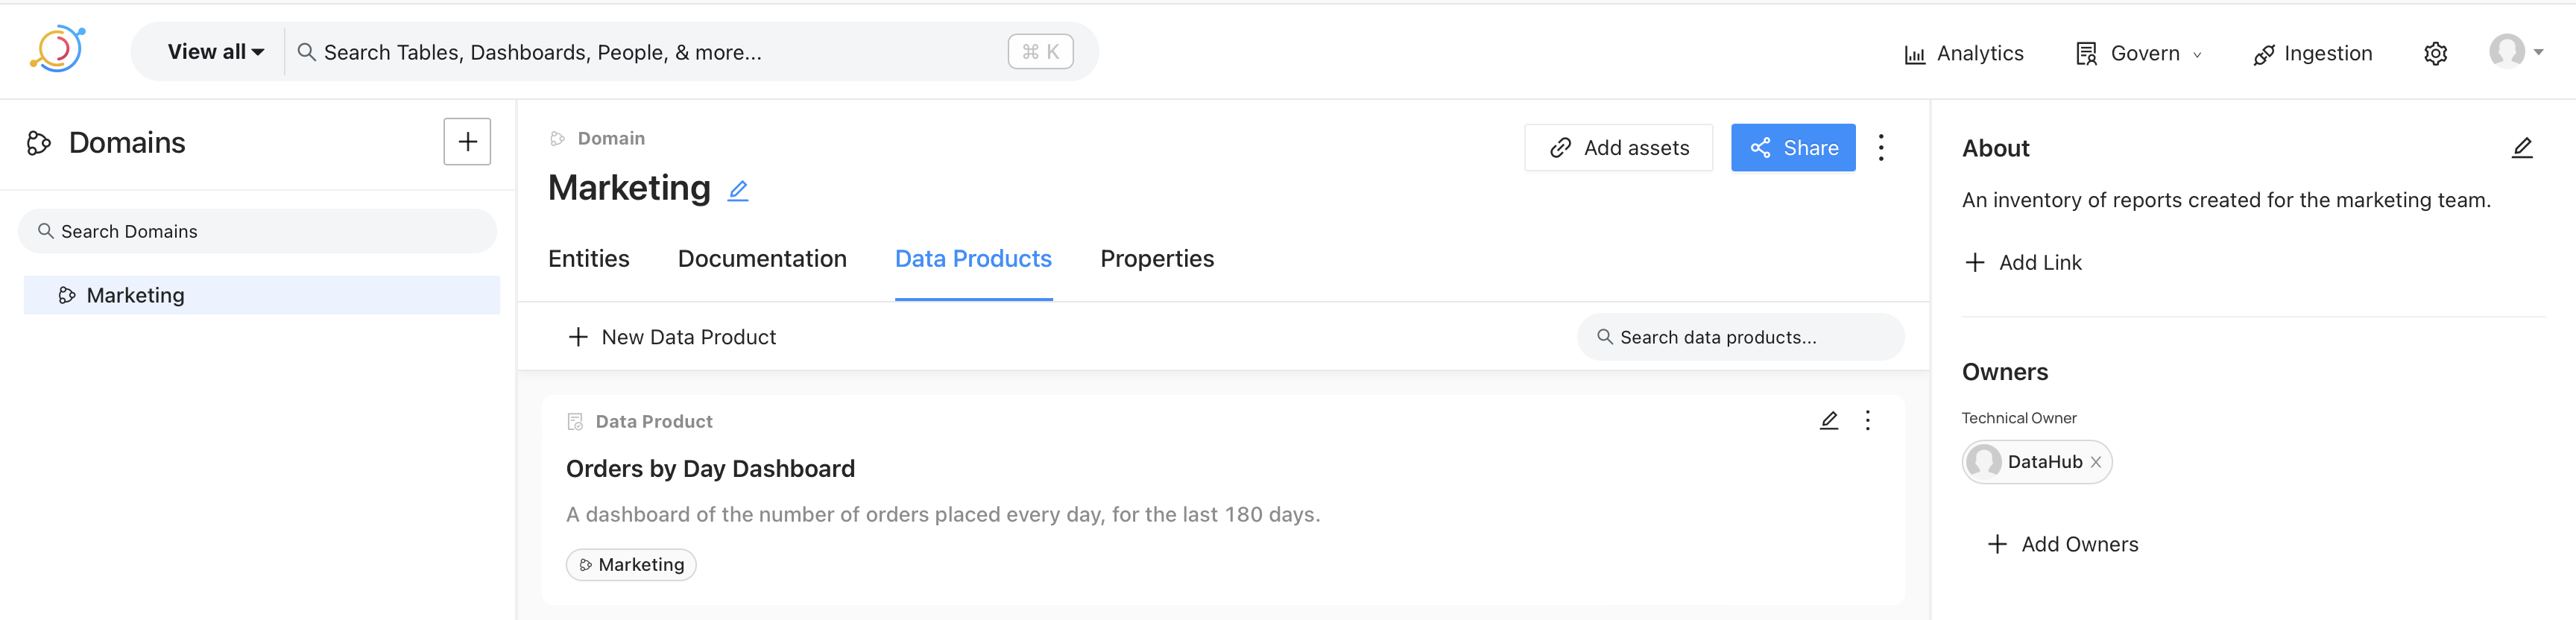
Data products
Finally, we’ll create a data product. This is the catalog of reports and dashboards created for various departments. For example, the image below shows a dashboard created for the marketing team.
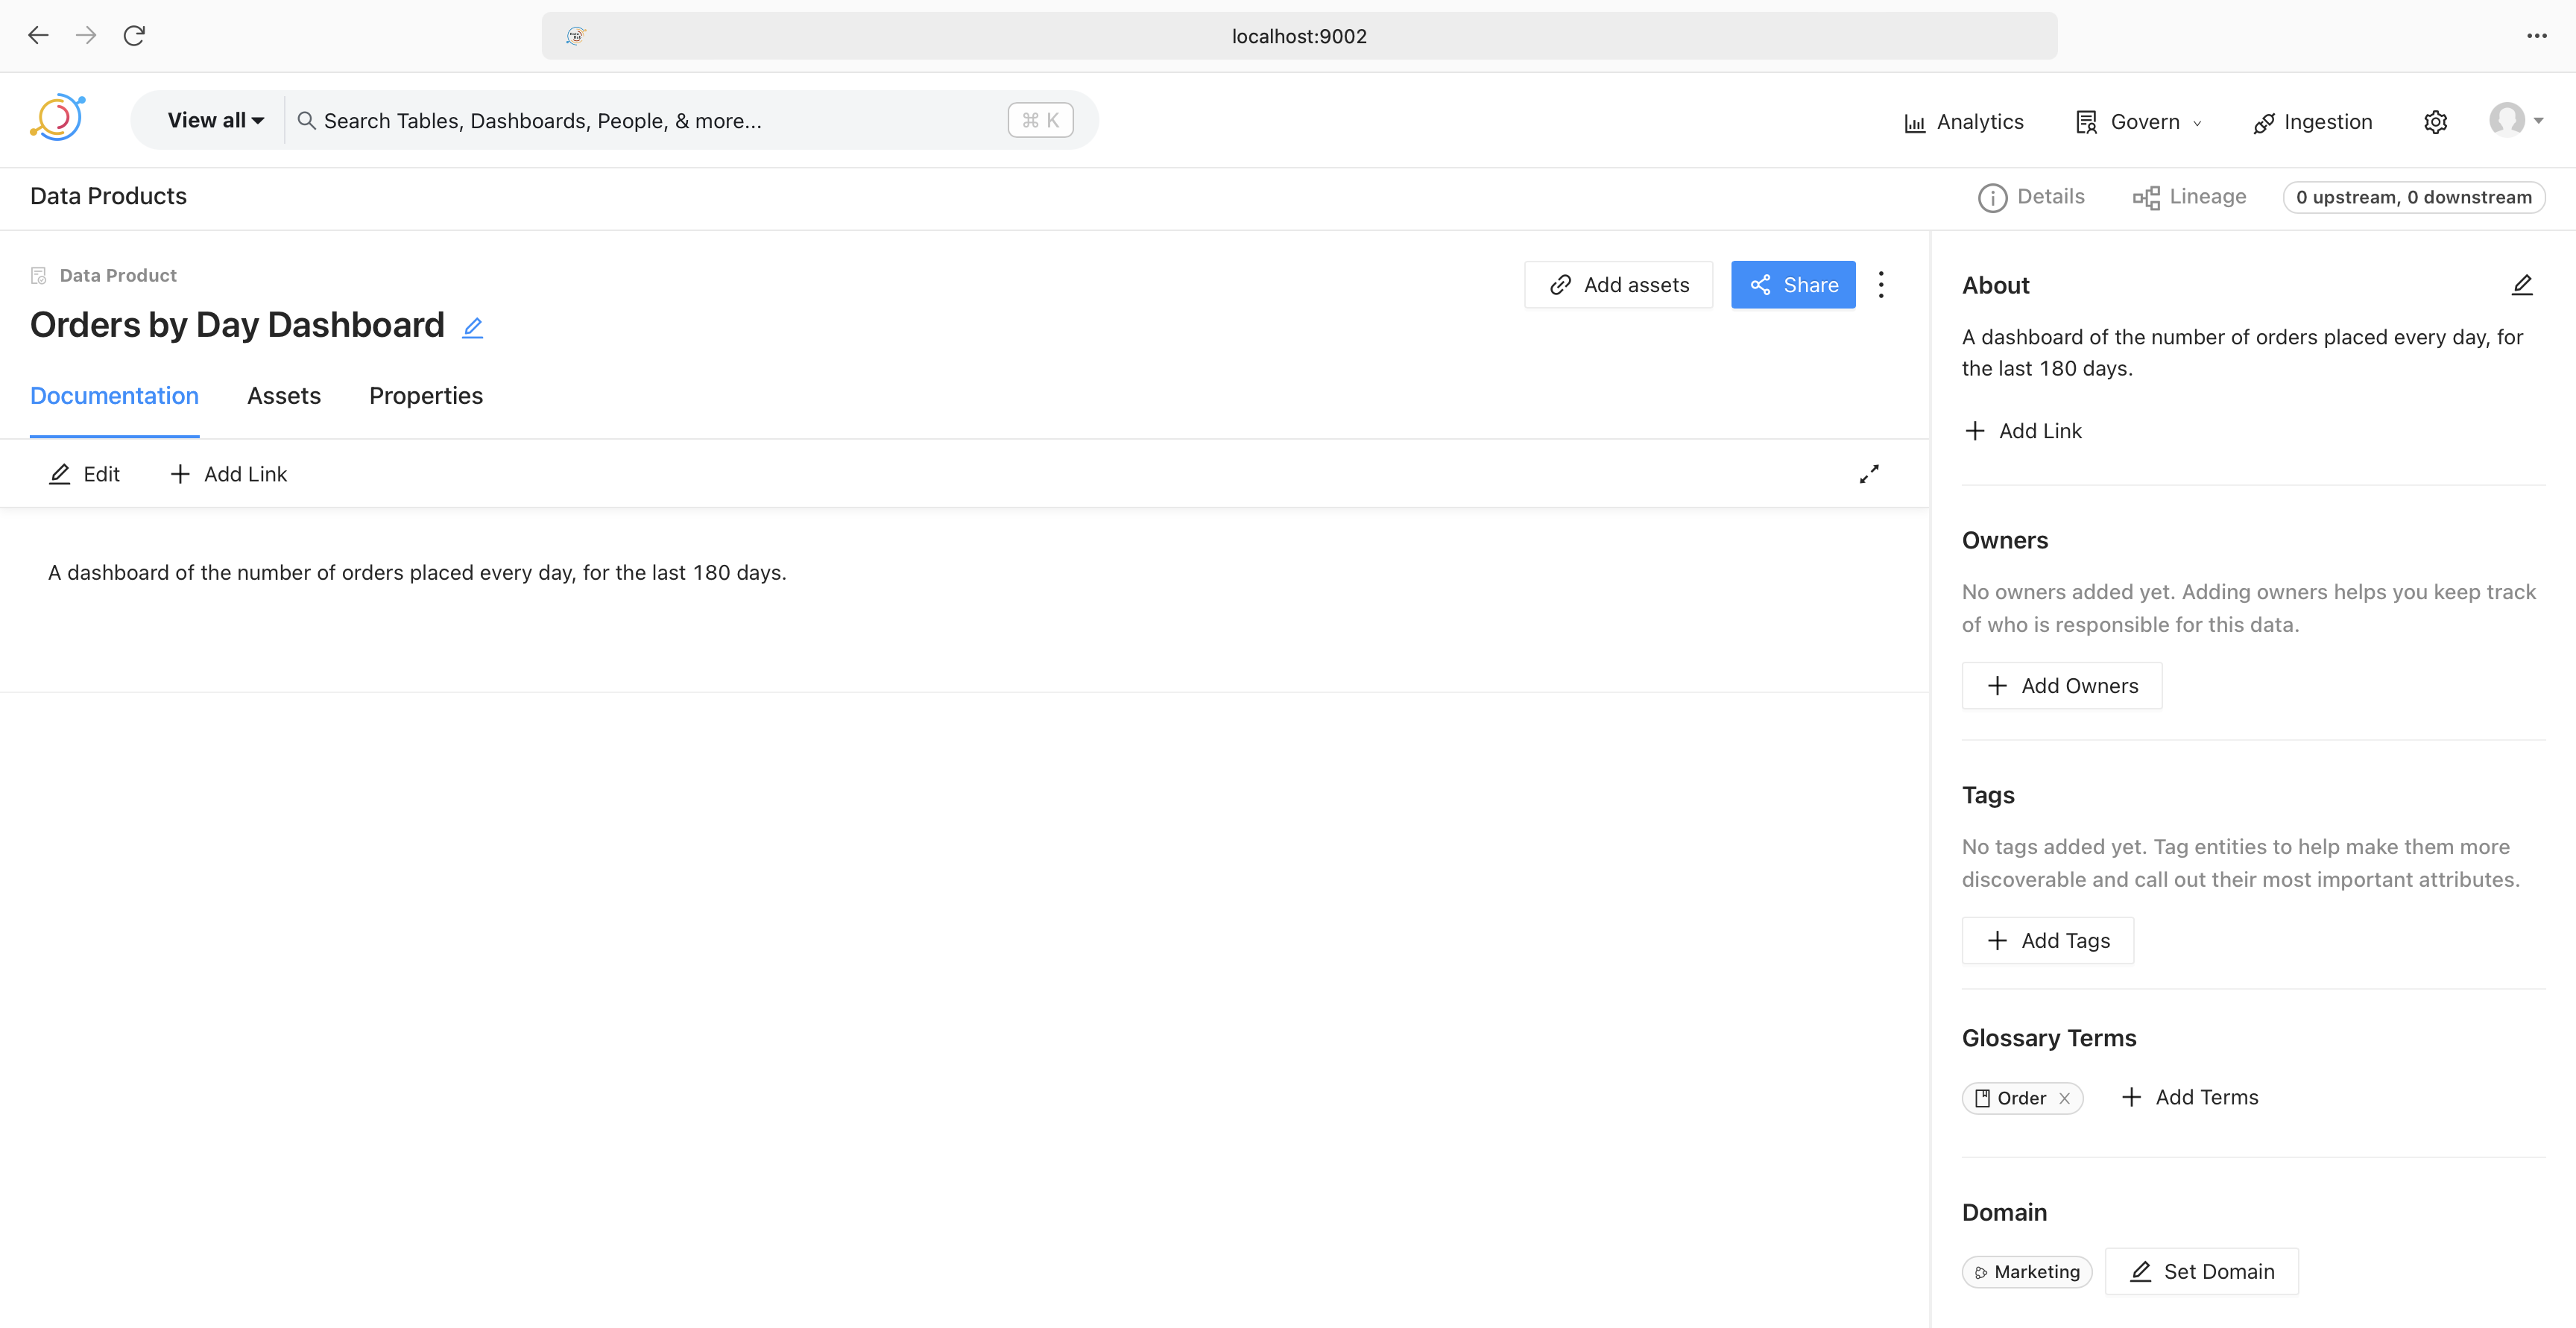
Expanding the dashboard allows us to look at the documentation for the report. This could contain the definition of the terms used in the report, as shown on the bottom right, a link to the dashboard in Superset, definitions of data points, report owners, and so on.
That’s it. That’s how a data catalog helps streamline working with data.